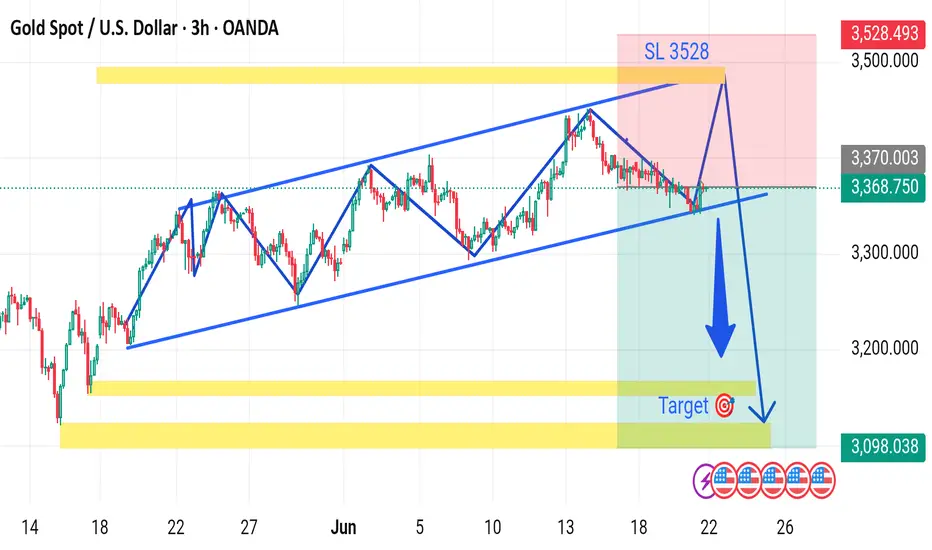
The chart you provided is a technical analysis of Gold Spot (XAU/USD) on a 3-hour timeframe, showing a bearish setup with the following key features:
---
🔍 Chart Analysis Summary:
Price Channel:
The price has been moving within an ascending channel (marked by two blue lines) but is now testing the lower boundary of this channel.
Breakout Direction:
A bearish breakout is projected, indicated by the large blue downward arrow. This suggests a possible trend reversal from bullish to bearish.
Entry & Target:
Current Price: ~3368.75
Target Price: ~3098.03
This matches the previous demand/support zone (yellow horizontal band near the bottom).
Stop Loss (SL):
Placed at 3528, just above recent highs to manage risk.
Risk Zone:
The red area shows the risk if price moves against the trade (stop loss zone).
The green area shows the reward zone (target profit area), highlighting a favorable risk/reward ratio.
Event Indicators:
Several economic event icons are placed near the projected move date (~June 24–26), suggesting that fundamental catalysts may support this move (e.g., FOMC, CPI, etc.).
---
✅ Bearish Setup Summary:
Setup Type: Bearish channel breakout
Sell Entry: On break and close below channel support (~3368)
Stop Loss: 3528
Take Profit: 3098
R/R Ratio: Favorable
Would you like a written trade plan or a summary in table format?
---
🔍 Chart Analysis Summary:
Price Channel:
The price has been moving within an ascending channel (marked by two blue lines) but is now testing the lower boundary of this channel.
Breakout Direction:
A bearish breakout is projected, indicated by the large blue downward arrow. This suggests a possible trend reversal from bullish to bearish.
Entry & Target:
Current Price: ~3368.75
Target Price: ~3098.03
This matches the previous demand/support zone (yellow horizontal band near the bottom).
Stop Loss (SL):
Placed at 3528, just above recent highs to manage risk.
Risk Zone:
The red area shows the risk if price moves against the trade (stop loss zone).
The green area shows the reward zone (target profit area), highlighting a favorable risk/reward ratio.
Event Indicators:
Several economic event icons are placed near the projected move date (~June 24–26), suggesting that fundamental catalysts may support this move (e.g., FOMC, CPI, etc.).
---
✅ Bearish Setup Summary:
Setup Type: Bearish channel breakout
Sell Entry: On break and close below channel support (~3368)
Stop Loss: 3528
Take Profit: 3098
R/R Ratio: Favorable
Would you like a written trade plan or a summary in table format?
t.me/+EQ88IkMSUvQwMGJk
Join telegram channel free
t.me/+EQ88IkMSUvQwMGJk
Join telegram channel free
t.me/+EQ88IkMSUvQwMGJk
Disclaimer
The information and publications are not meant to be, and do not constitute, financial, investment, trading, or other types of advice or recommendations supplied or endorsed by TradingView. Read more in the Terms of Use.
t.me/+EQ88IkMSUvQwMGJk
Join telegram channel free
t.me/+EQ88IkMSUvQwMGJk
Join telegram channel free
t.me/+EQ88IkMSUvQwMGJk
Disclaimer
The information and publications are not meant to be, and do not constitute, financial, investment, trading, or other types of advice or recommendations supplied or endorsed by TradingView. Read more in the Terms of Use.