XAU / USD ( Gold / U.S Dollar ) Technical Analysis Chart Update
Time Frame - H2
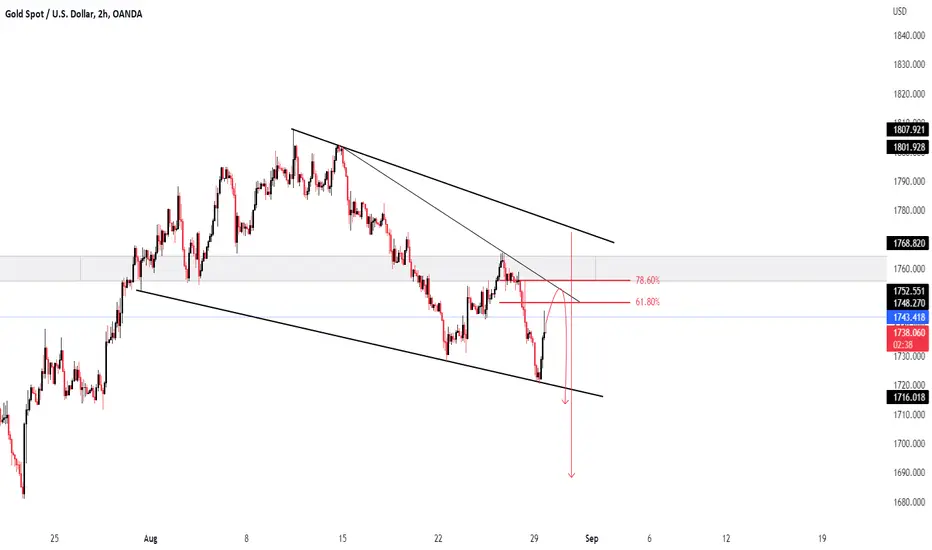
According to the Long Time Frame #LTL we have Falling Wedge Pattern and it has Rejected the Bearish Trend from the Lower Trend Line #LTL
If we look in Shorter Time Frame #STF we have 2 Strong Levels for Sell ( 1745 - 1753 ) if it rejects from these Levels then we can Enter in Sell
Another Thing we have is Strong Buying Divergence in #RSI
1753 is a good Level according to Daily Time Frame and Fibonacci Level - 78.60 as well
Time Frame - H2
According to the Long Time Frame #LTL we have Falling Wedge Pattern and it has Rejected the Bearish Trend from the Lower Trend Line #LTL
If we look in Shorter Time Frame #STF we have 2 Strong Levels for Sell ( 1745 - 1753 ) if it rejects from these Levels then we can Enter in Sell
Another Thing we have is Strong Buying Divergence in #RSI
1753 is a good Level according to Daily Time Frame and Fibonacci Level - 78.60 as well
Disclaimer
The information and publications are not meant to be, and do not constitute, financial, investment, trading, or other types of advice or recommendations supplied or endorsed by TradingView. Read more in the Terms of Use.
Disclaimer
The information and publications are not meant to be, and do not constitute, financial, investment, trading, or other types of advice or recommendations supplied or endorsed by TradingView. Read more in the Terms of Use.