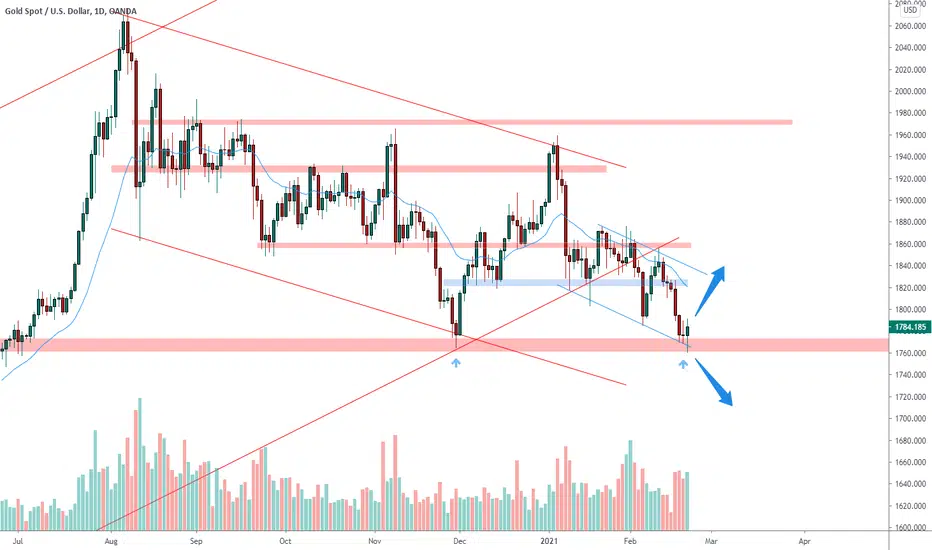
GOLD on the daily chart reached the weekly support at the 1770 area.
The market after an attempt to break close the daily candle above the structure.
The price, which is retracing in a descending channel, provides us 2 possible scenarios for the next weeks.
If the market will start a new impulse to the upside following the double bottom we can set a nice long order.
IF the market instead will break below the support we will look for a lower low in a continuation of the descending channel.
What do you expect? Drop a comment below with your vision!
--––
Follow the Shrimp 🦐
Keep in mind.
🟣 Purple structure -> Monthly structure.
🔴 Red structure -> Weekly structure.
🔵 Blue structure -> Daily structure.
🟡 Yellow structure -> 4h structure.
⚫️ Black structure -> <4h structure.
Here is the Plancton0618 technical analysis , please comment below if you have any question.
The ENTRY in the market will be taken only if the condition of the Plancton0618 strategy will trigger
Note
Disclaimer
The information and publications are not meant to be, and do not constitute, financial, investment, trading, or other types of advice or recommendations supplied or endorsed by TradingView. Read more in the Terms of Use.
Disclaimer
The information and publications are not meant to be, and do not constitute, financial, investment, trading, or other types of advice or recommendations supplied or endorsed by TradingView. Read more in the Terms of Use.