1. Market Structure & Trend
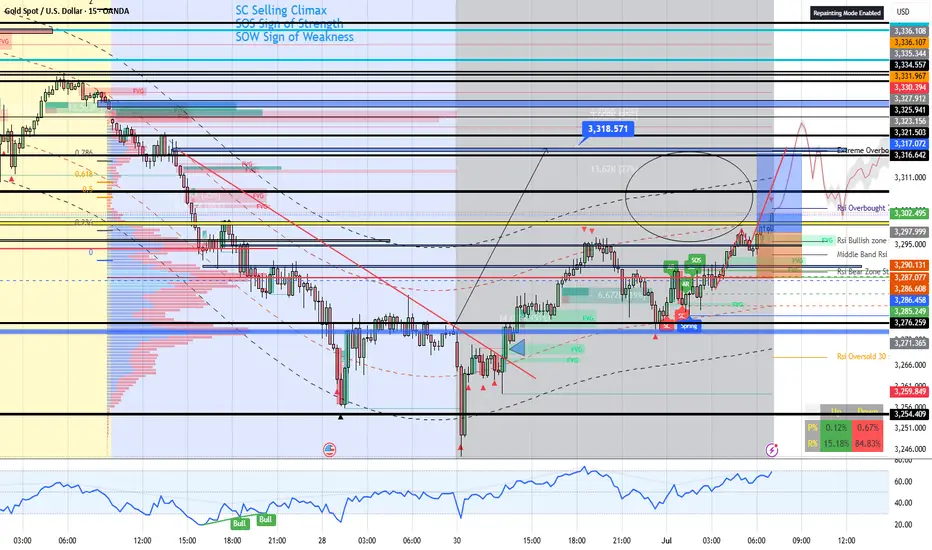
Recent Downtrend: The left side of the chart shows a sharp, persistent decline, with price breaking through multiple support levels.
Base Formation: After the selloff, gold found support (marked “Spring” and “SC”—Selling Climax) and began consolidating, forming a base.
Reversal Signs: The chart shows classic Wyckoff accumulation signals:
SC (Selling Climax): Panic selling exhausts sellers.
Spring: Final shakeout, trapping late shorts.
AR (Automatic Rally): First strong bounce.
SOS (Sign of Strength): Bullish breakout above resistance.
2. Key Levels & Zones
Support: Thick blue and black horizontal lines mark major support zones where price reversed.
Target: The blue label at 3,318.571 marks a major upside target, aligning with a prior high and a confluence of resistance.
3. Volume & Order Flow
Volume Profile: The red/blue histogram on the left shows heavy volume at lower prices, indicating accumulation. Lower volume above suggests less resistance if price rallies.
4. RSI & Momentum
Recently rebounded from oversold (below 30), supporting the bullish reversal.
Sign of Strength (SOS): Confirms buyers are in control for now.
Actionable Insights
Short-term: Bullish momentum is strong; price is likely to test the 3,318 resistance zone.
In summary:
If momentum holds, a breakout could trigger further upside; if not, a pullback or consolidation is likely.
Disclaimer
The information and publications are not meant to be, and do not constitute, financial, investment, trading, or other types of advice or recommendations supplied or endorsed by TradingView. Read more in the Terms of Use.
Disclaimer
The information and publications are not meant to be, and do not constitute, financial, investment, trading, or other types of advice or recommendations supplied or endorsed by TradingView. Read more in the Terms of Use.