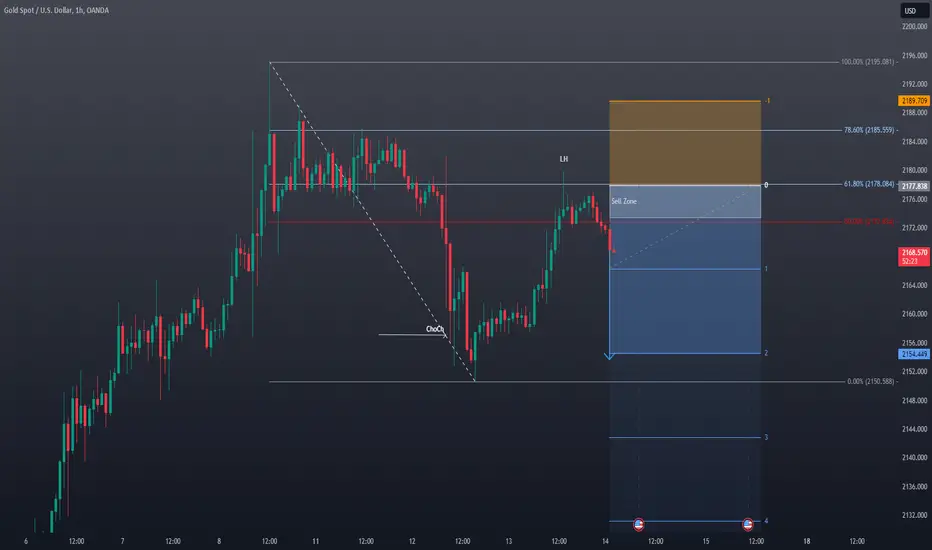
XAUUSD 1H chart, lower high, break of astructure to the downaide, looking for a sell at the 50-61.8% fibo zone. SL above the previous range high and 2R target at the swing low. Not financial advice.
Note
Apologies for the typos in the description, here's an amended version: XAUUSD (Gold) 1H chart shows a bearish setup with lower highs and a downside break of structure. I'm looking to enter a sell position within the 50-61.8% Fibonacci retracement zone, placing my stop-loss above the previous range high and targeting a 2R profit at the recent swing low.👀 🚀 Clarity In The CHAOS - See 'Buy/Sell Signals Built To WIN' Video: 🔥💰
🔗 youtu.be/LpVNUevggY8
👉Join Our Free DISCORD For MORE:
🔗 discord.com/invite/PcBeCdwVQq
🔗 youtu.be/LpVNUevggY8
👉Join Our Free DISCORD For MORE:
🔗 discord.com/invite/PcBeCdwVQq
Disclaimer
The information and publications are not meant to be, and do not constitute, financial, investment, trading, or other types of advice or recommendations supplied or endorsed by TradingView. Read more in the Terms of Use.
👀 🚀 Clarity In The CHAOS - See 'Buy/Sell Signals Built To WIN' Video: 🔥💰
🔗 youtu.be/LpVNUevggY8
👉Join Our Free DISCORD For MORE:
🔗 discord.com/invite/PcBeCdwVQq
🔗 youtu.be/LpVNUevggY8
👉Join Our Free DISCORD For MORE:
🔗 discord.com/invite/PcBeCdwVQq
Disclaimer
The information and publications are not meant to be, and do not constitute, financial, investment, trading, or other types of advice or recommendations supplied or endorsed by TradingView. Read more in the Terms of Use.