Driven by Trump’s tariff policies and geopolitical risks, gold has sustained a strong upward trajectory. However, after reaching around 3128, its momentum has visibly slowed, with multiple signs of pullbacks emerging within the short-term structure.
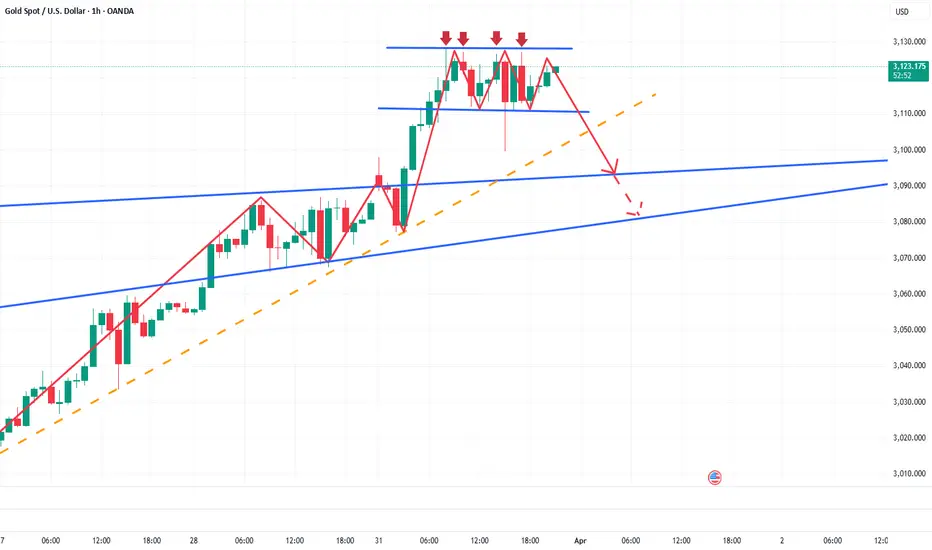
From the candlestick chart, it’s evident that gold has faced repeated rejection signals above 3125, characterized by long upper shadows. The 3125 level has now formed a notable resistance zone and appears to be acting as a short-term consolidation high. This price action increases the likelihood of a potential top formation.
Moreover, gold’s recent strength is largely attributed to growing concerns of a global trade war sparked by Trump’s tariff policies, prompting investors to rotate out of risk assets like equities and into safe-haven assets such as gold. However, if Trump softens his stance on the tariffs or adopts a more diplomatic approach to maintain confidence in the U.S. dollar, risk appetite may recover. This would likely drive funds back into equities and other risk assets, leading to an outflow from gold.
For gold trading, I prefer to avoid aggressively chasing long positions at this stage, as downside risks persist. If gold fails to decisively break through the 3125-3135 resistance zone, the bullish momentum may weaken, increasing the likelihood of a downward move. If gold break below the 3100 level during a pullback, it could accelerate further declines, with potential targets in the 3095-3085 range.
The trading strategy verification accuracy rate is more than 90%; one step ahead, exclusive access to trading strategies and real-time trading settings
Trade active
Gold is still fluctuating in a narrow range of 3125-3120, and there is no strong sign of breakthrough for the time being. However, relatively speaking, the current upward momentum is gradually weakening. If gold consumes or wastes more bullish momentum in this area, then after a certain degree of consumption, gold will fall again. The first falling target area is 3115-3105, followed by 3095-3085.The trading strategy verification accuracy rate is more than 90%; one step ahead, exclusive access to trading strategies and real-time trading settings
Related publications
Disclaimer
The information and publications are not meant to be, and do not constitute, financial, investment, trading, or other types of advice or recommendations supplied or endorsed by TradingView. Read more in the Terms of Use.
Related publications
Disclaimer
The information and publications are not meant to be, and do not constitute, financial, investment, trading, or other types of advice or recommendations supplied or endorsed by TradingView. Read more in the Terms of Use.