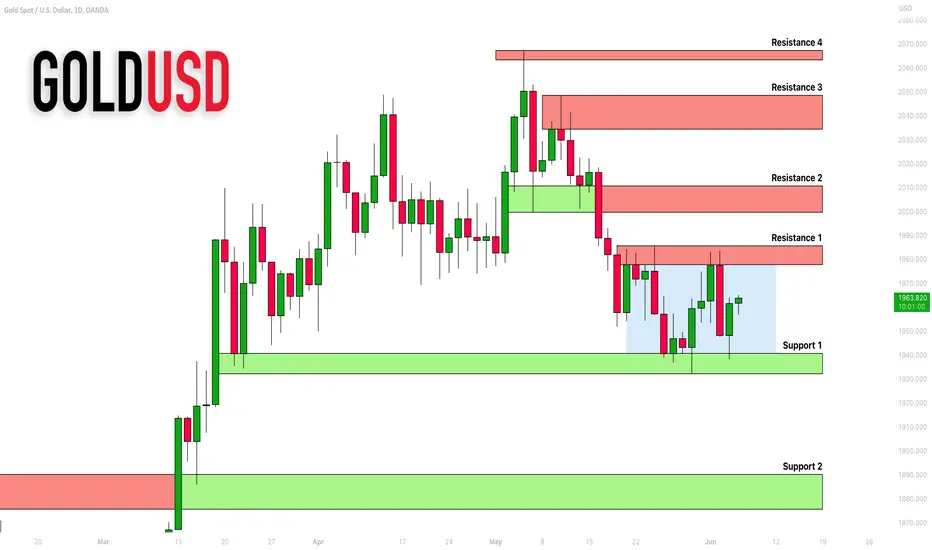
Here is my latest structure analysis for Gold.
Resistance 1: 1977 - 1985 area
Resistance 2: 1999 - 2010 area
Resistance 3: 2034 - 2048 area
Resistance 4: 2063 - 2066 area
Support 1: 1932 - 1940 area
Support 2: 1975 - 1989 area
The market is currently stuck within a horizontal range.
Its upper boundary is Resistance 1, its lower boundary is Support 1.
It looks like after the test of the support, we may expect a bullish movement up to Resistance 1 now.
❤️Please, support my work with like, thank you!❤️
✅Join My Telegram Channel: t.me/VasilyTrading
❗️YouTube Channel youtube.com/c/VasilyTrader
✅ Facebook: facebook.com/VasilyTrading/
⭐ My Forex & Gold Broker: bit.ly/vasilyforexbroker ⭐
❗️YouTube Channel youtube.com/c/VasilyTrader
✅ Facebook: facebook.com/VasilyTrading/
⭐ My Forex & Gold Broker: bit.ly/vasilyforexbroker ⭐
Related publications
Disclaimer
The information and publications are not meant to be, and do not constitute, financial, investment, trading, or other types of advice or recommendations supplied or endorsed by TradingView. Read more in the Terms of Use.