XAU/USD Head and Shoulders Breakdown Analysis
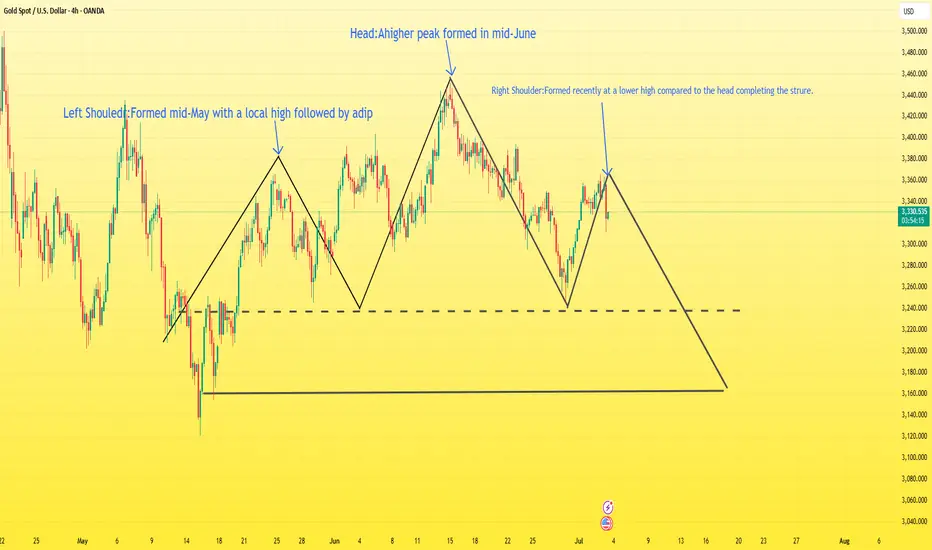
The chart shows a classic Head and Shoulders pattern forming on the 4H timeframe, indicating a potential bearish reversal setup.
Left Shoulder: Formed mid-May with a local high followed by a dip.
Head: A higher peak formed in mid-June.
Right Shoulder: Formed recently at a lower high compared to the head, completing the structure.
The neckline has been clearly defined, and price is currently hovering just above it. If the price breaks and closes below the neckline with strong bearish momentum, it would confirm the pattern.
Target: The projected target from the breakdown is around 3163, calculated by measuring the height from the head to the neckline and projecting it downward.
Outlook:
A confirmed break below the neckline would open the door for further downside toward the target zone.
Bears will be in control if price sustains below the neckline with increasing volume.
Wait for confirmation on the neckline break before considering short entries.
If you are a newbie or your account is burning, don't trust any advice easily. Contact me. I will give you free advice.
Trade active
Trade closed: target reached
An American man who loves life:
t.me/+f7MisaDxiAA2ZGQx
t.me/+f7MisaDxiAA2ZGQx
Disclaimer
The information and publications are not meant to be, and do not constitute, financial, investment, trading, or other types of advice or recommendations supplied or endorsed by TradingView. Read more in the Terms of Use.