🔍 Overview:
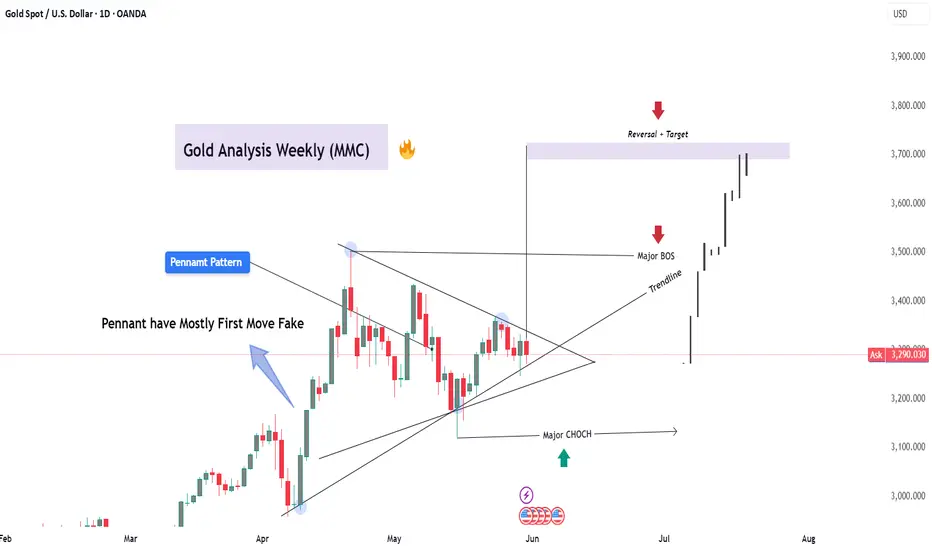
The XAU/USD (Gold) chart is displaying a textbook Pennant Pattern, and we are witnessing a powerful bullish breakout from this structure. This is a great example of how price consolidates before continuing its larger trend — in this case, upward.
Let’s break down each major component of the pattern and price behavior:
🧩 1. The Pennant Pattern – Continuation Structure
A Pennant typically forms after a strong impulsive move (flagpole), followed by a period of consolidation where price creates lower highs and higher lows, forming a triangle-like shape. This structure reflects market indecision, but it’s usually a pause before continuation.
In our case:
The rally in March–April built the flagpole
The April–May consolidation formed the pennant
The recent breakout signals trend continuation
🎭 2. Fake First Move – Classic Trap!
One of the key traits of pennants is the initial fake breakout—and that’s exactly what happened here.
The chart shows an early bearish break, which was a liquidity grab or fake move meant to trap retail traders who entered short too early.
Smart money often uses such tactics to create imbalance and then reverse the market in the opposite direction.
🔄 3. Major CHoCH (Change of Character)
Following the fake move, price reversed aggressively, breaking internal structure and forming a Major Change of Character (CHoCH).
This was the first signal that the bulls were back in control and that the bearish pressure was only temporary.
🧱 4. Major BOS (Break of Structure) & Trendline Break
The decisive move came next — when price broke above the upper trendline of the pennant and took out previous highs.
This break is what we call a Major BOS (Break of Structure) — a strong confirmation that the market is shifting from consolidation back into trend mode.
The breakout was backed by momentum candles, indicating institutional activity.
🎯 5. Target Zone: $3,700–$3,750 (Reversal Area)
Using the measured move technique (height of the flagpole projected from breakout point), the calculated target zone lies between $3,700 and $3,750.
This area is also marked as a potential reversal or profit-taking zone, so we might expect:
Partial pullback
Sideways action
Or even a deeper correction before continuation
📚 Key Technical Insights:
Component Observation
Pattern Bullish Pennant
First Move Bearish Fakeout
Confirmation Signal CHoCH + BOS
Trendline Break Yes, confirmed
Target Zone $3,700 – $3,750
Current Price ~$3,290 (at time of writing)
Bias Strong Bullish (short to mid-term)
🧠 Educational Takeaway:
“The first move is often the fake move.”
This is a golden rule in trading consolidation patterns like triangles and pennants. Always wait for confirmation (CHoCH + BOS) before committing capital to a trade. This strategy avoids traps and puts you on the right side of the market.
✅ Conclusion:
Gold (XAU/USD) has completed a successful bullish pennant breakout, and all key confirmations are in place.
We’re now eyeing the $3,700–$3,750 zone as the next target — with the potential for either reversal or continuation depending on how price reacts.
Keep an eye on this chart — the next few sessions could offer great setups for both swing and position traders.
Related publications
Disclaimer
The information and publications are not meant to be, and do not constitute, financial, investment, trading, or other types of advice or recommendations supplied or endorsed by TradingView. Read more in the Terms of Use.
Related publications
Disclaimer
The information and publications are not meant to be, and do not constitute, financial, investment, trading, or other types of advice or recommendations supplied or endorsed by TradingView. Read more in the Terms of Use.