In the near term, XAU/USD is neutral. The 4-hour chart shows a bearish 20 SMA keeps heading south below the current level after crossing below a flat 100 SMA. The 200 SMA, in the meantime, provides dynamic support at around $2,385.00. Finally, technical indicators have bounced from their recent lows but turned flat within neutral levels, somehow suggesting absent buying interest as per XAU/USD holding just below their midlines.
Support levels: 2,385.00 2,372.90 2,366.00
Resistance levels: 2,411.20 2,424.10 2,438.80
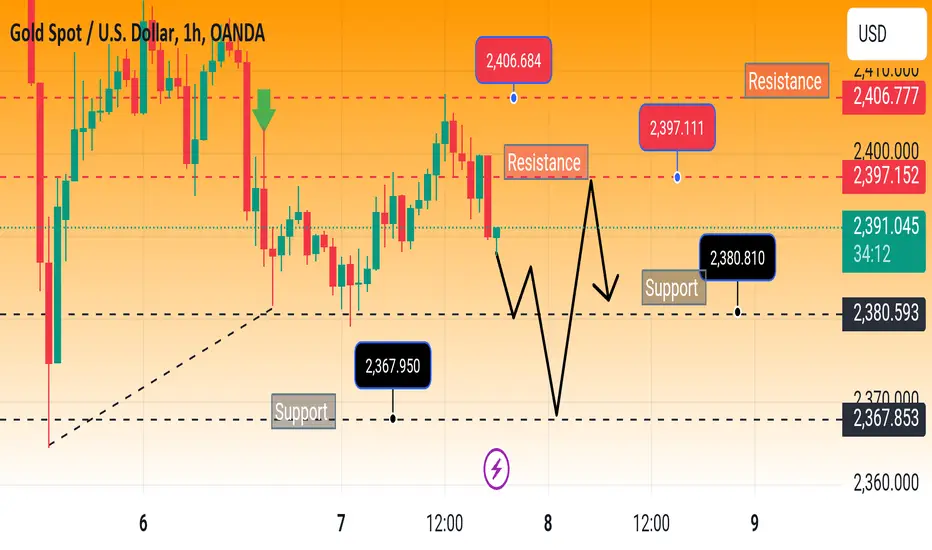
Gold now sell 2389
Target 2385
Target 2380
Target 2360
Sl 2411
Support levels: 2,385.00 2,372.90 2,366.00
Resistance levels: 2,411.20 2,424.10 2,438.80
Gold now sell 2389
Target 2385
Target 2380
Target 2360
Sl 2411
Note
Hello everyone Note
Follow my chart Note
Gold confirm signal Note
Gold sell 10 pips running Note
Gold sell 20 pips running Note
Gold sell 30 pips running Note
1 Target hit 60 pips done Note
Gold confirm signal Note
Follow my chart Note
Gold sell 70 pips running Note
Xauusd Note
Gold sell Note
Hello everyone Note
Follow my chart Note
Gold sell 80 pips running Note
Xauusd sell Note
Confirm trade Note
Follow my signal Note
Hello everyone Note
Follow my signal Note
Gold confirm sellGold signal
t.me/ProTrader_9
My Channel Link
t.me/ProTrader_9
Check My Performance
t.me/ProTrader_9
My Channel Link
t.me/ProTrader_9
Check My Performance
Disclaimer
The information and publications are not meant to be, and do not constitute, financial, investment, trading, or other types of advice or recommendations supplied or endorsed by TradingView. Read more in the Terms of Use.
Gold signal
t.me/ProTrader_9
My Channel Link
t.me/ProTrader_9
Check My Performance
t.me/ProTrader_9
My Channel Link
t.me/ProTrader_9
Check My Performance
Disclaimer
The information and publications are not meant to be, and do not constitute, financial, investment, trading, or other types of advice or recommendations supplied or endorsed by TradingView. Read more in the Terms of Use.