Market news:
In early Asian trading on Tuesday (July 29), spot gold fluctuated in a narrow range and is currently trading around $3,320 per ounce. The international gold price fell to a three-week low on Monday, mainly because the United States and the European Union reached a trade agreement over the weekend, boosting the dollar and risk sentiment. In addition, Trump said that he would impose a "global tariff" of 15% to 20% on most countries, which was different from his statement last week. The dollar index rose to a one-week high, making gold relatively expensive for investors holding other currencies.The volatile downward trend of London gold prices was not only directly affected by the trade agreement reached between the United States and Europe, but also closely related to the strong rebound of the US dollar index, the recovery of global risk appetite and the market's expectations for the Federal Reserve's interest rate policy. At the same time, the progress of Sino-US trade negotiations, Trump's tough stance on Russia and the Middle East, and the continued tension in geopolitics still add more uncertainty to the future trend of the gold market.Gold is facing multiple tests: the three unfavorable factors of a strong dollar, a rebound in risk appetite, and a rise in real interest rates have formed a combined force. In addition, the US Conference Board Consumer Confidence Index for July and the US JOLTs job vacancy data for June will also be released on this trading day, and investors need to pay attention to them.
Technical Review:
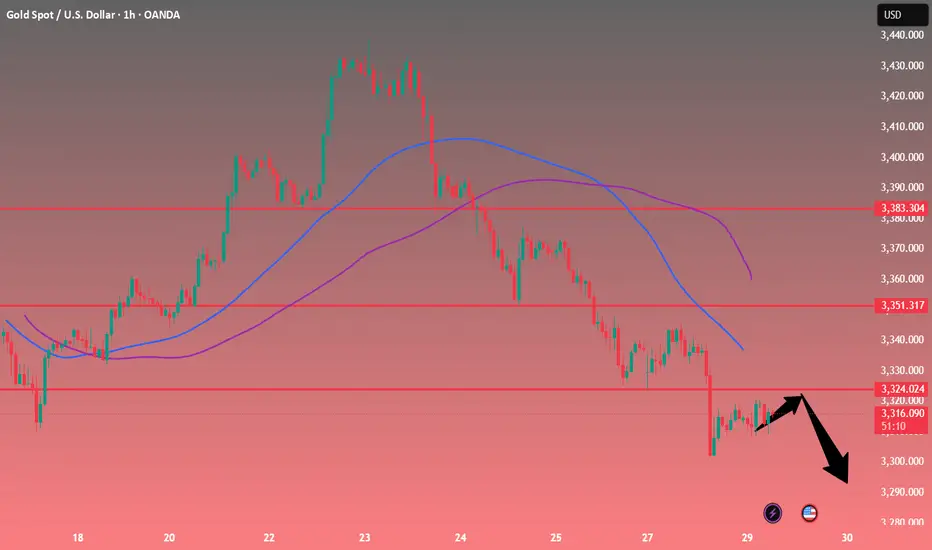
The further strengthening of the US dollar index has caused gold to continue to adjust close to the 3300 mark under pressure. As the price crosses below the short-term moving average, the current short-term moving average and other periodic indicators have begun to turn downward, and the Bollinger Bands as a whole are also intended to shrink. In addition, the macd indicator has a dead cross pattern again and has no upward intention, and it has a strong downward extension and obvious volume. Therefore, the daily line should continue to tend to sell. However, while selling, we should also pay attention to the strength of the rebound.The daily chart closed with a continuous negative structure, and the price was running in the middle and lower tracks of the Bollinger Bands and below the MA10 daily moving average of 3360. The short-term four-hour chart hourly chart Bollinger Bands opened downward, and the moving average opened downward. In addition, the macd indicator maintained a dead cross pattern, and the downward volume showed sufficient potential, so the 4-hour gold price can continue to participate in selling at a high level after a short-term rebound, assisting low-price buying!
Today's analysis:
Gold bears are galloping all the way, and gold buying has basically no rebound strength. Gold is still in a selling trend. Go with the trend, the trend is king, and continue to sell with the trend. As long as gold does not show an obvious buy reversal signal, then the rebound is to continue to sell gold to the end.The gold 1-hour moving average continues to form a dead cross selling arrangement. The selling strength of gold is still very strong, and gold selling will continue to exert its strength. Gold rebounded to 3318 yesterday, which is still a weak rebound. The watershed for buying and selling gold is now at 3330. Gold rebounds above 3330 in the Asian session, which is an opportunity to sell at highs.
Operation ideas:
Buy short-term gold at 3300-3302, stop loss at 3292, target at 3330-3350;
Sell short-term gold at 3330-3333, stop loss at 3342, target at 3300-3290;
Key points:
First support level: 3308, second support level: 3293, third support level: 3284
First resistance level: 3330, second resistance level: 3346, third resistance level: 3360
In early Asian trading on Tuesday (July 29), spot gold fluctuated in a narrow range and is currently trading around $3,320 per ounce. The international gold price fell to a three-week low on Monday, mainly because the United States and the European Union reached a trade agreement over the weekend, boosting the dollar and risk sentiment. In addition, Trump said that he would impose a "global tariff" of 15% to 20% on most countries, which was different from his statement last week. The dollar index rose to a one-week high, making gold relatively expensive for investors holding other currencies.The volatile downward trend of London gold prices was not only directly affected by the trade agreement reached between the United States and Europe, but also closely related to the strong rebound of the US dollar index, the recovery of global risk appetite and the market's expectations for the Federal Reserve's interest rate policy. At the same time, the progress of Sino-US trade negotiations, Trump's tough stance on Russia and the Middle East, and the continued tension in geopolitics still add more uncertainty to the future trend of the gold market.Gold is facing multiple tests: the three unfavorable factors of a strong dollar, a rebound in risk appetite, and a rise in real interest rates have formed a combined force. In addition, the US Conference Board Consumer Confidence Index for July and the US JOLTs job vacancy data for June will also be released on this trading day, and investors need to pay attention to them.
Technical Review:
The further strengthening of the US dollar index has caused gold to continue to adjust close to the 3300 mark under pressure. As the price crosses below the short-term moving average, the current short-term moving average and other periodic indicators have begun to turn downward, and the Bollinger Bands as a whole are also intended to shrink. In addition, the macd indicator has a dead cross pattern again and has no upward intention, and it has a strong downward extension and obvious volume. Therefore, the daily line should continue to tend to sell. However, while selling, we should also pay attention to the strength of the rebound.The daily chart closed with a continuous negative structure, and the price was running in the middle and lower tracks of the Bollinger Bands and below the MA10 daily moving average of 3360. The short-term four-hour chart hourly chart Bollinger Bands opened downward, and the moving average opened downward. In addition, the macd indicator maintained a dead cross pattern, and the downward volume showed sufficient potential, so the 4-hour gold price can continue to participate in selling at a high level after a short-term rebound, assisting low-price buying!
Today's analysis:
Gold bears are galloping all the way, and gold buying has basically no rebound strength. Gold is still in a selling trend. Go with the trend, the trend is king, and continue to sell with the trend. As long as gold does not show an obvious buy reversal signal, then the rebound is to continue to sell gold to the end.The gold 1-hour moving average continues to form a dead cross selling arrangement. The selling strength of gold is still very strong, and gold selling will continue to exert its strength. Gold rebounded to 3318 yesterday, which is still a weak rebound. The watershed for buying and selling gold is now at 3330. Gold rebounds above 3330 in the Asian session, which is an opportunity to sell at highs.
Operation ideas:
Buy short-term gold at 3300-3302, stop loss at 3292, target at 3330-3350;
Sell short-term gold at 3330-3333, stop loss at 3342, target at 3300-3290;
Key points:
First support level: 3308, second support level: 3293, third support level: 3284
First resistance level: 3330, second resistance level: 3346, third resistance level: 3360
Good trading signals can help you make profits in the market. I will share trading signal analysis of various products every day, hoping to help you!
t.me/+WHE58rEaywExNWVh
t.me/+WHE58rEaywExNWVh
Disclaimer
The information and publications are not meant to be, and do not constitute, financial, investment, trading, or other types of advice or recommendations supplied or endorsed by TradingView. Read more in the Terms of Use.