Last Friday, Trump threatened to escalate the trade war again, suggesting that a 50% tariff be imposed on the EU from June 1. The US dollar index continued to decline during the day, falling to a low of around 99. Due to increased risk aversion demand, spot gold once rose by more than 2%, reaching a daily high of $3,365. At the opening of this Monday, Trump issued a statement to postpone the imposition of tariffs on the EU, extending the deadline for the EU to face 50% tariffs to July 9. Gold was also affected, and it has continued to rectify its downward trend this week. Yesterday, the lowest point was near 3285.
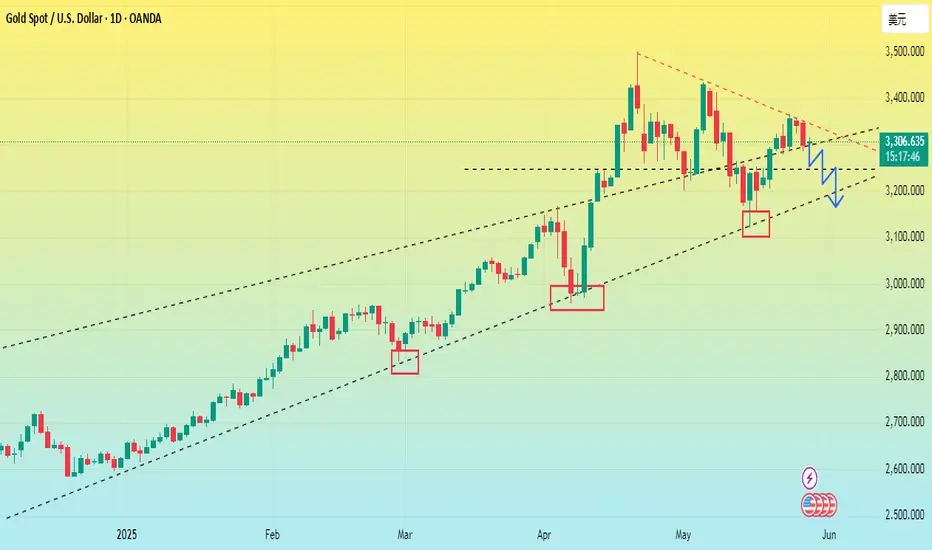
From the current daily chart, the trend support line here on the daily chart has been broken. So it is very likely that there will be a short-term correction trend on the daily line next. Once the lower 3250-3260 is broken, it will directly test the lower trend line of the daily line at 3160-3170.
From the 4-hour chart:

We can reverse the market. If we take the previous daily low of 3160 as the target, we can see that 3285 is exactly where it stopped and stabilized yesterday. So, it is normal for 3285 to rebound and consolidate. We can also see that the range of the 4-hour chart has been broken, so 3285 may fall directly and break through next. Then the next position to pay attention to is 3260-50. If it falls below this range, we can directly see the trend line support position of 3160-70 in this round of daily lines.
Trading is risky, and I hope my analysis can help traders reduce the risk of trading.
From the current daily chart, the trend support line here on the daily chart has been broken. So it is very likely that there will be a short-term correction trend on the daily line next. Once the lower 3250-3260 is broken, it will directly test the lower trend line of the daily line at 3160-3170.
From the 4-hour chart:
We can reverse the market. If we take the previous daily low of 3160 as the target, we can see that 3285 is exactly where it stopped and stabilized yesterday. So, it is normal for 3285 to rebound and consolidate. We can also see that the range of the 4-hour chart has been broken, so 3285 may fall directly and break through next. Then the next position to pay attention to is 3260-50. If it falls below this range, we can directly see the trend line support position of 3160-70 in this round of daily lines.
Trading is risky, and I hope my analysis can help traders reduce the risk of trading.
Related publications
Disclaimer
The information and publications are not meant to be, and do not constitute, financial, investment, trading, or other types of advice or recommendations supplied or endorsed by TradingView. Read more in the Terms of Use.
Related publications
Disclaimer
The information and publications are not meant to be, and do not constitute, financial, investment, trading, or other types of advice or recommendations supplied or endorsed by TradingView. Read more in the Terms of Use.