The attached image represents an advanced technical analysis of the gold (XAUUSD) chart using a set of advanced tools and methods, such as:
🧠 Elliott Wave Analysis:
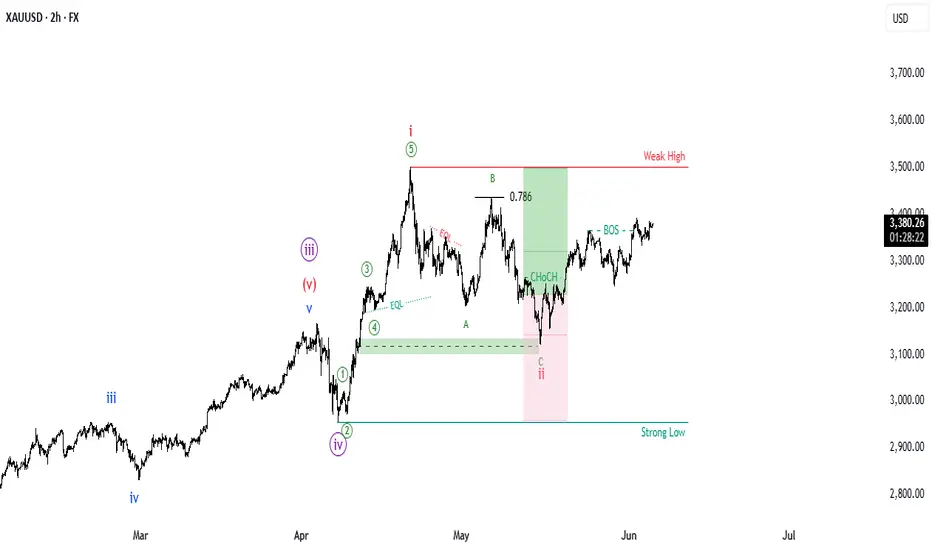
A clear sequence of waves is shown:
Wave (i) in red represents the peak.
Wave (ii) below (correction A-B-C).
Within the correction, we identified:
A then B (reaching 0.786 Fibonacci retracement of A).
Wave C ended in a demand zone.
📊 Smart Tools Used:
EQL (Equal Highs/Lows): Marked to highlight liquidity above the peaks.
CHOCH (Change of Character): Signals a change in trend from bearish to bullish.
BOS (Break of Structure): Indicates a breakout of a price structure (bullish here).
Demand Zone: A strong demand zone that has been responded to.
Weak High/Strong Low: To identify areas of volatility and the strength of buyers and sellers.
🔍 What this analysis indicates:
The end of an impulse wave (i) and a strong upward trend.
An A-B-C correction to a demand zone.
A strong upward rebound after the appearance of CHoCH and BOS.
Next prediction: The upward trend continues unless the Strong Low is broken.
🧠 Elliott Wave Analysis:
A clear sequence of waves is shown:
Wave (i) in red represents the peak.
Wave (ii) below (correction A-B-C).
Within the correction, we identified:
A then B (reaching 0.786 Fibonacci retracement of A).
Wave C ended in a demand zone.
📊 Smart Tools Used:
EQL (Equal Highs/Lows): Marked to highlight liquidity above the peaks.
CHOCH (Change of Character): Signals a change in trend from bearish to bullish.
BOS (Break of Structure): Indicates a breakout of a price structure (bullish here).
Demand Zone: A strong demand zone that has been responded to.
Weak High/Strong Low: To identify areas of volatility and the strength of buyers and sellers.
🔍 What this analysis indicates:
The end of an impulse wave (i) and a strong upward trend.
An A-B-C correction to a demand zone.
A strong upward rebound after the appearance of CHoCH and BOS.
Next prediction: The upward trend continues unless the Strong Low is broken.
Disclaimer
The information and publications are not meant to be, and do not constitute, financial, investment, trading, or other types of advice or recommendations supplied or endorsed by TradingView. Read more in the Terms of Use.
Disclaimer
The information and publications are not meant to be, and do not constitute, financial, investment, trading, or other types of advice or recommendations supplied or endorsed by TradingView. Read more in the Terms of Use.