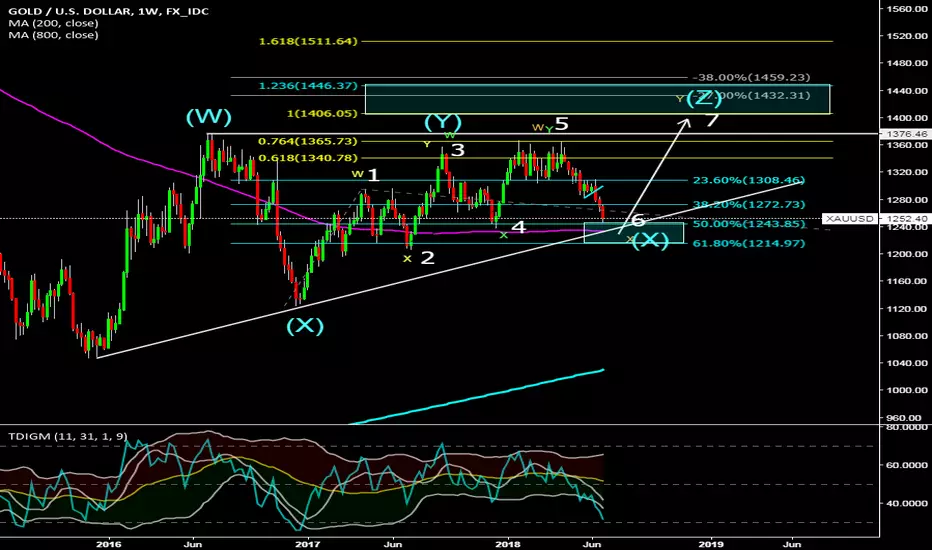
Gold counts out pattern and fib wise for one more up, every way I look at it which would make sense, breaking the high it never broke. When you look at the chart with nothing on it, it looks like a sell, but not when you consider the modern swings of the market. It is at the 50% retrace, approaching the 200 MA on weekly. It just reacted to the 800 MA on the daily. Don't just jump in a buy without a strategy and accounting for time frame. There was a 1 hr diagonal and but entry off the 50% fib and 800 on daily. I believe that to be the first entry on attempting for the swing, but I would think we would get more of a reversal pattern. This may take some time. But AudUsd did come of the exact level I indicated to the pip. If that was to keep going, Gold may too. At this point I would be looking for setups and definitely watching that 200MA on weekly, and the .618 level.
Disclaimer
The information and publications are not meant to be, and do not constitute, financial, investment, trading, or other types of advice or recommendations supplied or endorsed by TradingView. Read more in the Terms of Use.
Disclaimer
The information and publications are not meant to be, and do not constitute, financial, investment, trading, or other types of advice or recommendations supplied or endorsed by TradingView. Read more in the Terms of Use.