We have been bearish on Gold (XAUUSD) since the March (war) peak and especially since the start of the month have been warning of a potential $100 collapse:
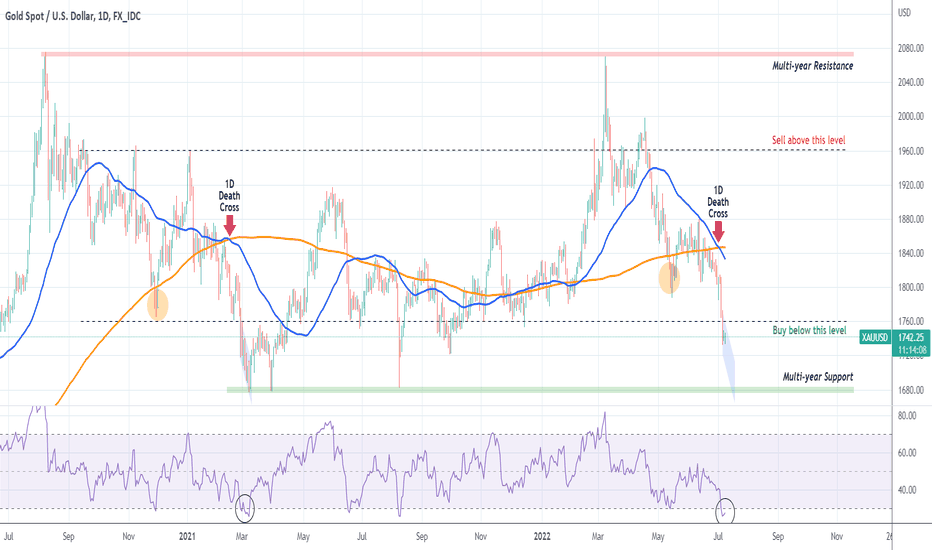
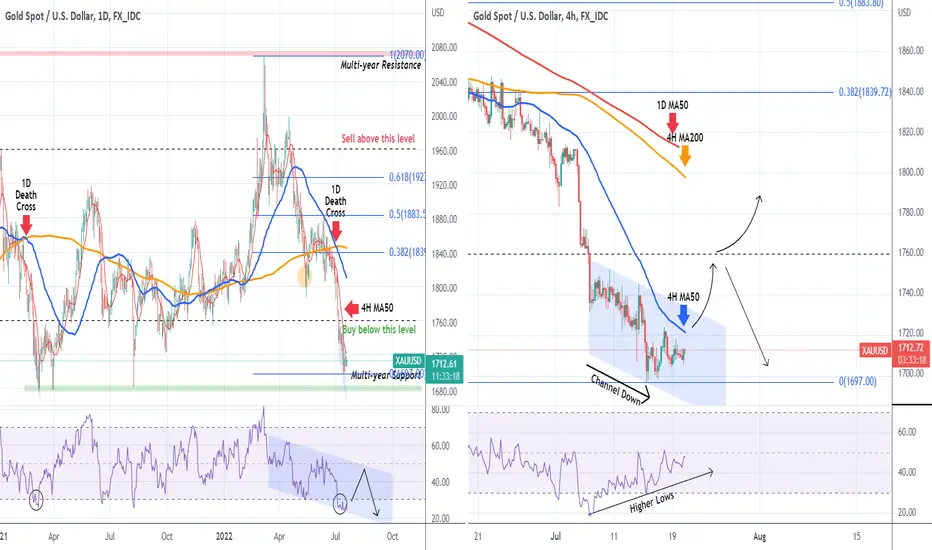
This time however we have a number of indicators pushing the scale in favor of (short-term at least) buying again after 2 months. The chart on the left is on the 1D time-frame, while the one on the right is on the 4H. As we see on the 1D, the RSI started to find Support while trading within a Channel Down since April. This could be similar to the March 2021 bottom that made a short-term rebound to 1755.
With 4H showing the price action since July 06 within a Channel Down but the 4H RSI on Higher Lows (bullish divergence), we are waiting for a break of the 4H MA50 (blue trend-line on the 4H chart, red on the 1D) to target 1755. A new break above 1760 constitutes a new bullish break-out signal towards the 4H MA200 (orange trend-line) - 1D MA50 (red trend-line on the 4H chart, blue trend-line on the 1D chart) cluster. After that we have to evaluate based on the macro-economics at the time. There are the Fibonacci retracement levels involved for a longer-term approach.
A rejection on the 4H MA50 or the 1760 Resistance, are both short-term sell signals.
--------------------------------------------------------------------------------------------------------
Please like, subscribe and share your ideas and charts with the community!
--------------------------------------------------------------------------------------------------------
👑Best Signals (Forex/Crypto+70% accuracy) & Account Management (+20% profit/month on 10k accounts)
💰Free Channel t.me/tradingshotglobal
🤵Contact info@tradingshot.com t.me/tradingshot
🔥New service: next X100 crypto GEMS!
💰Free Channel t.me/tradingshotglobal
🤵Contact info@tradingshot.com t.me/tradingshot
🔥New service: next X100 crypto GEMS!
Disclaimer
The information and publications are not meant to be, and do not constitute, financial, investment, trading, or other types of advice or recommendations supplied or endorsed by TradingView. Read more in the Terms of Use.