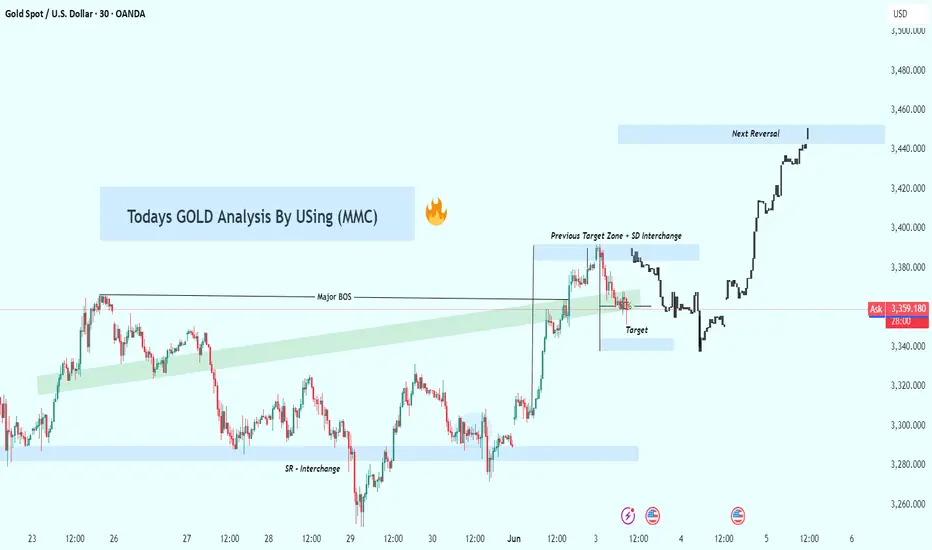
🧠 Overview:
Today’s GOLD chart shows clear institutional footprints using the Market Maker Concept (MMC). We're seeing a sequence of liquidity sweeps, breaks of structure (BOS), and supply/demand (SD) interchanges, all pointing to a well-orchestrated bullish expansion.
This detailed analysis will break down:
Key structure shifts and manipulation zones
BOS confirmations and their implications
Upcoming reversal target zone and trade management suggestions
🔍 Chart Breakdown:
🔸 1. SR Interchange Zone (Demand Zone)
Around $3,270 – $3,280, price showed strong bullish rejection.
This zone represents a Support-Resistance Flip, where price absorbed sell-side liquidity before launching upward.
Market Makers often use this zone to induce short positions, then reverse to trap retail sellers.
🔸 2. Major BOS (Break of Structure)
Occurred near $3,365, signaling a confirmed bullish shift in market structure.
This BOS is important because it shows displacement, a core MMC trait where institutions break structure with momentum.
Once BOS was confirmed, price formed a short-term pullback, aligning with re-accumulation principles.
🔸 3. Previous Target Zone + SD Interchange
Around $3,370 – $3,385, previously identified as a resistance/target zone.
After breaking this zone, price retested it and turned it into new support (SD Interchange).
This is a common MMC move: old resistance becomes a new demand zone post-manipulation.
🔸 4. Target Hit & Bullish Continuation
Price surged upward and hit the next logical target, pausing briefly.
This confirms that the market is following liquidity engineering – price sweeps zones to collect orders, then pushes higher.
🔸 5. Next Reversal Zone: $3,440 – $3,460
This is a key supply zone based on prior inefficiencies and potential smart money exits.
Traders should watch this zone carefully for signs of bearish reaction:
Rejection wicks
Bearish engulfing patterns
RSI/MACD divergence
Volume exhaustion
💡 Trade Strategy Ideas:
✅ Bullish Bias (If price holds above BOS)
Buy retracements into demand zones (e.g., $3,365 or $3,385)
Targets: $3,420 and then $3,450
Use trailing stops to lock in profits
❌ Bearish Setup (Upon reversal signs in $3,440 – $3,460 zone)
Look for short confirmations like lower highs or bearish engulfing candles
Targets: $3,385 (former demand) or $3,365 (BOS level)
⚠️ Risk Management:
Stick to 1-2% risk per trade
Wait for confirmation before entering any reversal
Set clear invalidation levels (above $3,460 for shorts)
🔚 Conclusion:
This GOLD analysis demonstrates classic MMC and Smart Money behavior:
BOS with confirmation
Institutional demand flip
Precise target fulfillment
Approaching a high-probability reversal zone
The next few sessions will be critical. Stay sharp and patient—let the market confirm the next direction.
For Daily Trade Setups and Forecast: 📈 t.me/xauusdoptimizer
Premium Signals Fr33: 💯 t.me/xauusdoptimizer
🥰🥳🤩
Premium Signals Fr33: 💯 t.me/xauusdoptimizer
🥰🥳🤩
Related publications
Disclaimer
The information and publications are not meant to be, and do not constitute, financial, investment, trading, or other types of advice or recommendations supplied or endorsed by TradingView. Read more in the Terms of Use.