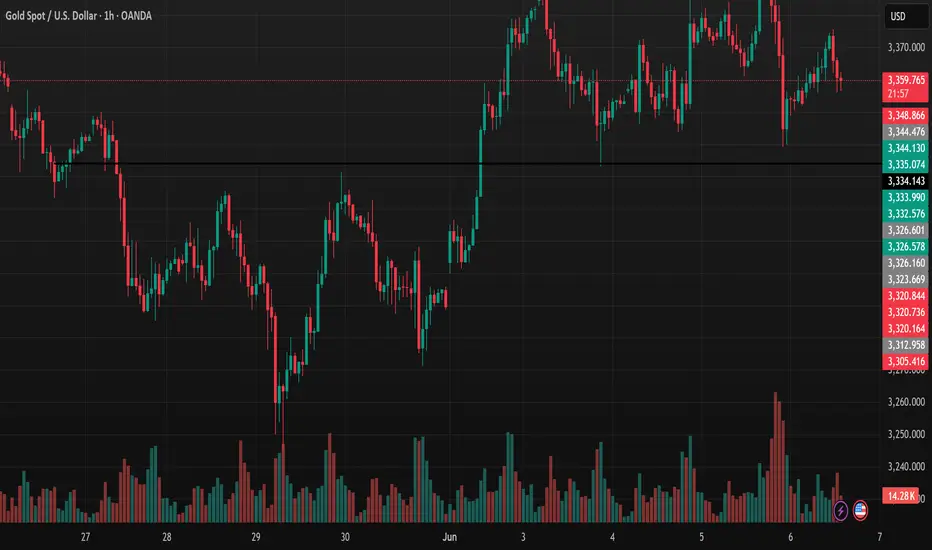
Harmonic price patterns are chart patterns based on Fibonacci ratios and market geometry, used to identify potential reversal points in Forex. They rely on Fibonacci levels (e.g., 0.618, 0.786, 1.618) to measure price structures, predicting reversal zones (PRZ - Potential Reversal Zone).
Key Features:
- Based on Fibonacci ratios.
- Geometric structure with 4-5 points (X, A, B, C, D).
- Identifies PRZ for buy/sell opportunities.
- Symmetrical, reflecting market psychology.
Key Harmonic Patterns in Forex:
1. Gartley:
- AB retraces 61.8% of XA.
- D at 78.6% of XA.
- Buy/sell at D.
2. Bat:
- AB retraces 38.2-50% of XA.
- D at 88.6% of XA.
- High-precision at D.
3. Crab:
- CD extends 161.8% of XA.
- D at extreme levels.
- Suited for strong volatility.
4. Butterfly:
- AB retraces 78.6% of XA.
- D extends 127-161.8% of XA.
- End of strong trends.
5. Shark:
- AB retraces 113-161.8% of XA.
- D at 88.6-113% of XA.
- Volatile markets.
6. Cypher:
- CD retraces 78.6% of XC.
- Short-term timeframes.
How to Use:
1. Measure Fibonacci ratios to identify the pattern.
2. Locate PRZ at D, combine with support/resistance, RSI, or candlestick patterns.
3. Set stop-loss beyond PRZ, aim for risk/reward ≥ 1:2.
4. Enter trades at D after price/indicator confirmation.
Notes:
- Requires precise measurements.
- Combine with other tools for reliability.
- Practice on a demo account first.
- Avoid during high-volatility events (e.g., news releases).
Let me know if you need details on a specific pattern!
🪙 JOIN OUR FREE TELEGRAM GROUP 🪙
t.me/dnaprofits
Join the community group to get support and share knowledge!
️🥇 Exchange and learn market knowledge
️🥇 Support free trading signals
t.me/dnaprofits
Join the community group to get support and share knowledge!
️🥇 Exchange and learn market knowledge
️🥇 Support free trading signals
Disclaimer
The information and publications are not meant to be, and do not constitute, financial, investment, trading, or other types of advice or recommendations supplied or endorsed by TradingView. Read more in the Terms of Use.
