📍 Overview:
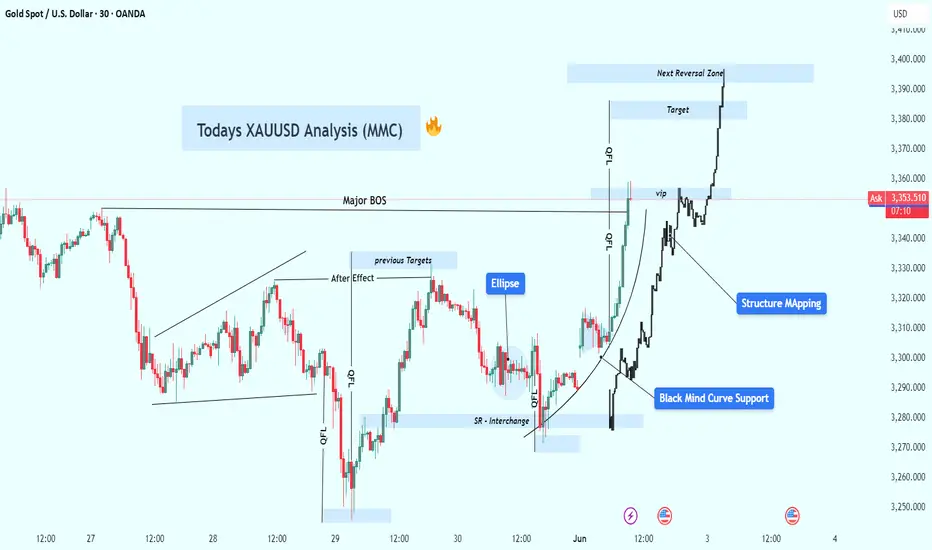
In today's Gold (XAUUSD) 30-minute chart, we’re witnessing a flawless execution of MMC (Mind Mapping Concept) strategy combined with SMC (Smart Money Concept) principles. This is a perfect case study for traders who want to understand how psychology, curve-based support, and structural mapping come together to create a high-probability bullish setup.
🔍 Full Breakdown of the Chart
1. Initial Market Behavior: Liquidity Grab & Structural Shift
The market begins with a bearish drop, clearing liquidity below the previous consolidation.
This is followed by a QFL zone (Quick Flip Level), which acts as a smart money accumulation point.
Shortly after, price rebounds from the SR Interchange zone, where resistance transforms into support—a key MMC signal for upcoming structural shift.
🧠 Key Concept: Smart money often grabs liquidity before making a move. These zones are critical for identifying market reversals.
2. Black Mind Curve Support – Dynamic Trend Logic
The Black Mind Curve is a dynamic support curve, not a traditional trendline. It represents how the market naturally flows, mapping out the collective psychology of buyers.
Price respects this curve multiple times, forming higher lows—each one stronger than the last.
This is where patient MMC traders build their positions, aligning entries with psychological market rhythm.
🔥 Why It Matters: While static lines may break under pressure, dynamic curves breathe with the market, providing more accurate structure support.
3. Structure Mapping – Tracking Market Intentions
Structure Mapping is one of the core MMC techniques—tracking the "story" price action is telling through:
BOS (Break of Structure)
QFL traps
SR interchanges
Internal higher-highs and higher-lows
The Major BOS line indicates a key shift in market direction from bearish to bullish, a confirmation point for trend-followers.
📌 Lesson: Once BOS is confirmed, the probability favors continuation rather than reversal.
4. Ellipse Trap – The Psychological Kill Zone
This blue-highlighted ellipse zone marks where retail traders often get manipulated—buying false breakouts or shorting fake reversals.
Price consolidates inside this ellipse before launching upwards.
MMC refers to this phase as the “After Effect”—where true momentum begins after psychological traps are triggered.
🎯 Insight: Never enter a trade inside the ellipse unless you clearly understand market context—it’s where the market “confuses the masses.”
5. VIP Zone – The High-Probability Entry Window
The VIP zone is a small but powerful price area where risk is minimized, and reward is maximized.
It aligns with the curve, inner structure support, and BOS retest. This is your ideal entry zone, especially for those using curve-based confirmations.
🔑 Pro Tip: This is the sniper entry for MMC traders. Small SL, big reward. Enter after internal confirmation like pin bars or bullish engulfing.
6. Target Zone & Next Reversal Area
After the explosive breakout, price hits the projected target marked clearly on the chart.
The move aligns with prior imbalance zones and market inefficiencies, filling previous gaps.
The market is now approaching the Next Reversal Zone, highlighted in blue—this is where MMC traders start watching for signs of exhaustion.
📉 What to Watch:
Slowing bullish candles
Bearish divergence on RSI or momentum indicators
Sudden spikes in volume with no further upside
📚 Key MMC Concepts in This Chart:
Concept Description
QFL Zone Quick Flip Level; a liquidity trap zone before reversals.
Black Mind Curve Curved support line reflecting psychological market flow.
Structure Mapping Tracking HH/HL and BOS to define clear market bias.
Ellipse Trap Market maker zone used to trap and reverse retail traders.
VIP Entry Zone The safest and most efficient entry after structure confirmation.
Next Reversal Zone Anticipated resistance based on confluence of previous S/R and imbalance.
🧠 Strategic Conclusion:
This analysis perfectly illustrates how combining SMC with MMC enhances your trading edge. It’s not about predicting price, but understanding structure, reading psychology, and entering at high-probability points.
Whether you're a scalper, day trader, or swing trader, using curve-based mapping like the Black Mind Curve gives you a fluid understanding of price, beyond rigid lines and lagging indicators.
💡 Final Thoughts:
📈 Follow the Story, Not the Noise.
📉 Enter Where It Makes Sense, Exit Where Others Get Emotional.
⚡ Use MMC to Read What the Market is Really Saying.
✅ Action Plan:
🔍 Monitor price in the Next Reversal Zone.
📉 Look for exhaustion signals before considering shorts.
🟢 If bullish continuation holds above target zone, next micro-level target would be derived from 1.618 Fibonacci extension.
Related publications
Disclaimer
The information and publications are not meant to be, and do not constitute, financial, investment, trading, or other types of advice or recommendations supplied or endorsed by TradingView. Read more in the Terms of Use.
Related publications
Disclaimer
The information and publications are not meant to be, and do not constitute, financial, investment, trading, or other types of advice or recommendations supplied or endorsed by TradingView. Read more in the Terms of Use.