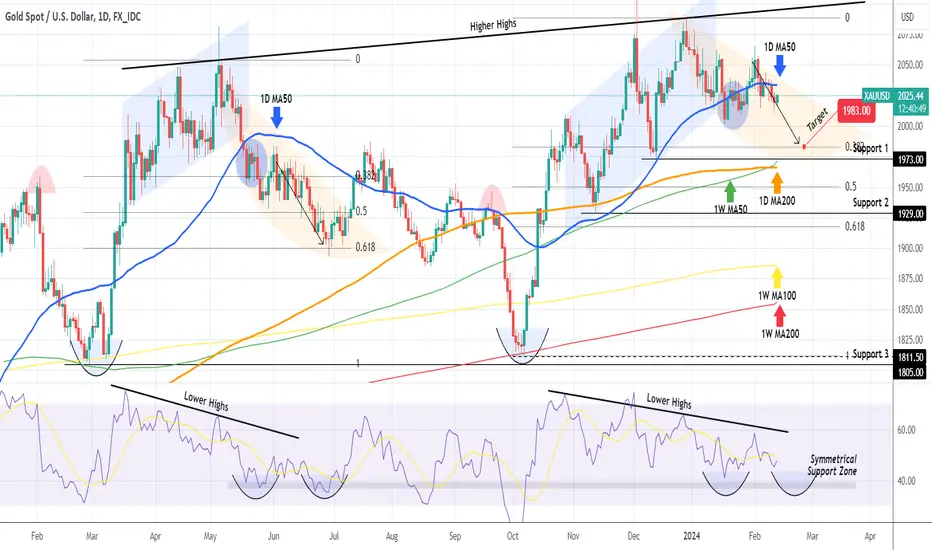
Gold (XAUUSD) has dropped again below the 1D MA50 (blue trend-line) and contrary to our last short-term signal (February 07, see chart below), we look today on a longer term monthly basis on the 1D time-frame:

As long as the price stays below the 1D MA50, it is very likely to see the current rejection transition into a Bearish Leg for the whole month of February and test the strong long-term Support cluster of the 0.382 Fibonacci level, Support 1 and the 1W MA50 (green trend-line).
This pattern expectation emerges due to the similarities of the current price action with what led and followed the May 04 2023 High. The 1D RSI in particular between the two sequences are identical and suggests that we might be on a Bearish Leg similar to June's 2023, which bottomed on a double Low on the Support Zone.
Our Target is therefore 1983 (0.382 Fibonacci). It's worth mentioning that all 1W MAs were Supports in the past 12 months, the 1W MA200 (red trend-line) on the October 06 2023 Low and the 1W MA100 (yellow trend-line) on the February 28 2023 Low. That makes the 1W MA50 very relevant.
-------------------------------------------------------------------------------
** Please LIKE 👍, FOLLOW ✅, SHARE 🙌 and COMMENT ✍ if you enjoy this idea! Also share your ideas and charts in the comments section below! This is best way to keep it relevant, support us, keep the content here free and allow the idea to reach as many people as possible. **
-------------------------------------------------------------------------------
💸💸💸💸💸💸
👇 👇 👇 👇 👇 👇
👑Best Signals (Forex/Crypto+70% accuracy) & Account Management (+20% profit/month on 10k accounts)
💰Free Channel t.me/tradingshotglobal
🤵Contact info@tradingshot.com t.me/tradingshot
🔥New service: next X100 crypto GEMS!
💰Free Channel t.me/tradingshotglobal
🤵Contact info@tradingshot.com t.me/tradingshot
🔥New service: next X100 crypto GEMS!
Disclaimer
The information and publications are not meant to be, and do not constitute, financial, investment, trading, or other types of advice or recommendations supplied or endorsed by TradingView. Read more in the Terms of Use.