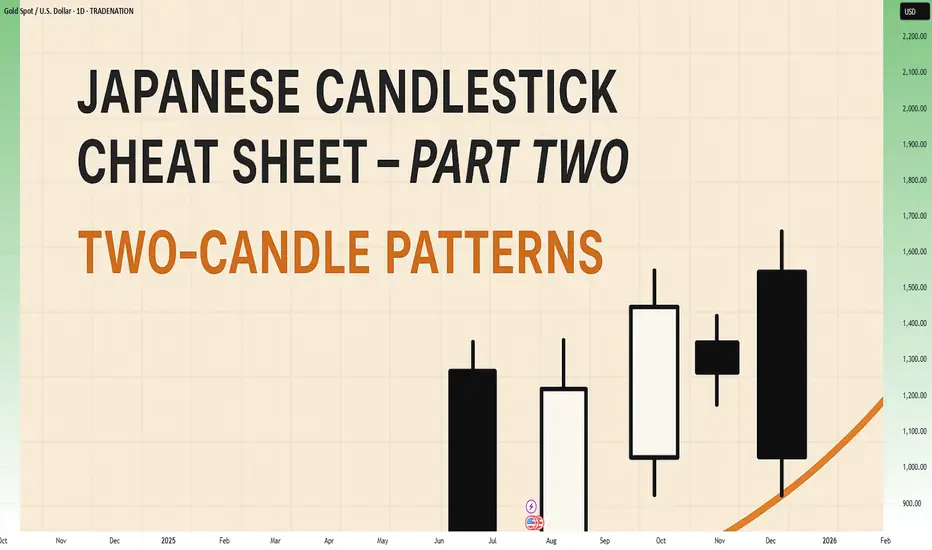
Two-Candle Patterns That Signal Shifts in Sentiment
Single candles whisper…
But two candles talk to each other — and when they do, they often reveal the first signs of a reversal or continuation.
In this second part of the series, we go deeper.
From engulfings to haramis, tweezer tops to piercing lines — these patterns don’t just look good on charts… they capture the psychological tug-of-war between buyers and sellers.
Price doesn’t lie.
And two candles in a row can say: “Something just changed.”
Learn to spot them early. Learn to listen when the chart speaks.
This is Part Two of your practical guide to mastering candlestick formations.
BULLISH KICKER

Bias: Bullish
What is the Bullish Kicker pattern?
The Bullish Kicker forms when a strong bullish candle follows a bearish one with no overlap between the two, indicating a sudden shift in sentiment. This pattern is a powerful indicator of a reversal as buyers take control. The sharp contrast between the bearish and bullish candles reflects a dramatic shift in market psychology, where bears are caught off-guard and forced to cover their positions.
Bullish Kickers are rare but extremely telling, providing a clear signal that sentiment is favoring buyers. Recognizing such decisive patterns can be a game-changer.
Meaning:
Found after downtrends or sell-offs; suggests a sudden shift in sentiment, indicating strong buying interest and potential trend reversal.
BULLISH ENGULFING

Bias: Bullish
What is the Bullish Engulfing pattern?
The Bullish Engulfing pattern occurs when a large bullish candle fully engulfs the previous smaller bearish candle, signaling a potential trend reversal. This pattern highlights a moment when buyers overpower sellers, often marking the beginning of upward momentum. Psychologically, it suggests that buyer confidence is returning, and sellers are losing their grip.
For traders, understanding Bullish Engulfing patterns can provide crucial entry points into emerging trends. Learning to identify and trade such patterns is essential for capturing momentum and new trends.
Meaning:
Typically found in downtrends, this pattern signals a potential bullish reversal as buyers overpower sellers, often indicating a shift toward upward momentum.
BULLISH HARAMI

Bias: Bullish
What is the Bullish Harami pattern?
The Bullish Harami consists of a small bullish candle within a preceding larger bearish one, indicating a pause in downward momentum and hinting at a potential reversal. This pattern shows that sellers are beginning to weaken as buyers cautiously test the waters. The Harami reflects a shift in sentiment from bearish to neutral, often marking a transitional phase in the market.
Interpreting the Bullish Harami helps traders spot moments when sentiment is shifting, potentially signaling the start of a trend change.
Meaning:
Seen in downtrends, it suggests indecision, with possible bullish reversal if the following candles confirm buying strength, indicating a weakening bearish trend.
PIERCING LINE

Bias: Bullish
What is the Piercing Line pattern?
The Piercing Line forms when a bullish candle opens below the previous bearish candle’s low but closes over halfway into it. Found in downtrends, this pattern reflects strong buying pressure as buyers step in at lower prices, creating a potential bullish reversal. The Piercing Line pattern suggests that sentiment may be shifting as buyers gain confidence.
This pattern’s strength lies in its psychological impact, revealing moments when buyers are willing to take risks. Recognizing these signs early can provide valuable insights for traders looking to time entries.
Meaning:
Found in downtrends, this pattern suggests a possible bullish reversal if buying continues, as sellers lose control to buyers.
TWEEZER BOTTOM

Bias: Bullish
What is the Tweezer Bottom pattern?
The Tweezer Bottom pattern is characterized by two consecutive candles with nearly identical lows, one bearish and one bullish. This pattern often signals the end of a downtrend, as the matching lows suggest a strong support level where buyers are stepping in. The Tweezer Bottom highlights market psychology at work, with sellers unable to push prices lower, reflecting renewed buying interest.
Tweezer Bottoms are ideal for traders looking to identify support zones and potential reversal points. By understanding this pattern’s significance, traders can make informed decisions.
Meaning:
Found in downtrends, it signals potential reversal, showing strong support at the matching low, suggesting buyers are stepping in.
BEARISH KICKER

Bias: Bearish
What is the Bearish Kicker pattern?
The Bearish Kicker is the inverse of the Bullish Kicker, forming when a strong bearish candle follows a bullish one without overlap, indicating a sharp sentiment shift. This pattern often marks a sudden reversal, with sellers taking control after an initial bullish period. Psychologically, Bearish Kickers are powerful, signaling that buyers are caught off-guard and losing momentum.
Recognizing Bearish Kickers provides traders with insights into sudden shifts in market dynamics, helping them avoid buying into weakening trends.
Meaning:
Found after uptrends; indicates a sudden sentiment shift, signaling potential trend reversal and intensified selling pressure.
BEARISH ENGULFING

Bias: Bearish
What is the Bearish Engulfing pattern?
The Bearish Engulfing pattern forms when a large bearish candle engulfs the previous smaller bullish candle, suggesting a potential reversal in an uptrend. This pattern signals that sellers have regained control, often marking the start of downward momentum. The Bearish Engulfing reveals a psychological shift, as selling pressure overtakes buying interest.
This pattern is a powerful tool for traders who aim to catch trend reversals, allowing them to align with emerging downward momentum.
Meaning:
Typically found in uptrends, this pattern signals a potential bearish reversal as sellers overpower buyers, often indicating a downward momentum shift.
BEARISH HARAMI

Bias: Bearish
What is the Bearish Harami pattern?
The Bearish Harami consists of a small bearish candle contained within a larger preceding bullish one, reflecting indecision and a potential trend reversal. Found in uptrends, it hints that buyers are losing strength, while sellers are cautiously testing the market. This pattern highlights moments when buyer momentum begins to wane, suggesting caution.
Interpreting the Bearish Harami allows traders to spot potential shifts in sentiment, helping them manage risk and time their exits.
Meaning:
Seen in uptrends, it suggests indecision with a potential bearish reversal if following candles confirm, indicating a weakening bullish trend.
DARK CLOUD COVER

Bias: Bearish
What is the Dark Cloud Cover pattern?
The Dark Cloud Cover appears when a bearish candle opens above the previous bullish candle but closes over halfway into it, reflecting a shift in control from buyers to sellers. This pattern suggests that bullish momentum may be fading, hinting at a potential reversal. Dark Cloud Cover patterns reveal moments when sentiment shifts from optimism to caution.
For traders, understanding this pattern helps them anticipate reversals at the top of uptrends.
Meaning:
Found in uptrends; signals potential bearish reversal if selling continues, as buyers lose control to sellers.
TWEEZER TOP

Bias: Bearish
What is the Tweezer Top pattern?
The Tweezer Top is formed by two candles with matching or nearly matching highs, typically one bullish and one bearish. This pattern signals potential resistance, as sellers are consistently pushing back against the same level. The Tweezer Top reflects a moment of seller strength, often marking the end of an uptrend.
Recognizing Tweezer Tops helps traders spot resistance zones and potential reversal points, allowing them to avoid buying into weakening trends or even shorting the asset.
Meaning:
Found in uptrends, it signals potential reversal, showing strong resistance at the matching high, suggesting selling pressure.
🧭 Final Thought
Two-candle formations often appear at key turning points — right where most traders hesitate or get trapped.
Learn to read them not just as patterns, but as conversations between candles — one pushing, the other reacting.
And if this is your first time reading the series, don’t miss Part One – where we covered single-candle signals like dojis, hammers, and marubozus — the very foundations of candlestick reading.
Single candles whisper…
But two candles talk to each other — and when they do, they often reveal the first signs of a reversal or continuation.
In this second part of the series, we go deeper.
From engulfings to haramis, tweezer tops to piercing lines — these patterns don’t just look good on charts… they capture the psychological tug-of-war between buyers and sellers.
Price doesn’t lie.
And two candles in a row can say: “Something just changed.”
Learn to spot them early. Learn to listen when the chart speaks.
This is Part Two of your practical guide to mastering candlestick formations.
BULLISH KICKER
Bias: Bullish
What is the Bullish Kicker pattern?
The Bullish Kicker forms when a strong bullish candle follows a bearish one with no overlap between the two, indicating a sudden shift in sentiment. This pattern is a powerful indicator of a reversal as buyers take control. The sharp contrast between the bearish and bullish candles reflects a dramatic shift in market psychology, where bears are caught off-guard and forced to cover their positions.
Bullish Kickers are rare but extremely telling, providing a clear signal that sentiment is favoring buyers. Recognizing such decisive patterns can be a game-changer.
Meaning:
Found after downtrends or sell-offs; suggests a sudden shift in sentiment, indicating strong buying interest and potential trend reversal.
BULLISH ENGULFING
Bias: Bullish
What is the Bullish Engulfing pattern?
The Bullish Engulfing pattern occurs when a large bullish candle fully engulfs the previous smaller bearish candle, signaling a potential trend reversal. This pattern highlights a moment when buyers overpower sellers, often marking the beginning of upward momentum. Psychologically, it suggests that buyer confidence is returning, and sellers are losing their grip.
For traders, understanding Bullish Engulfing patterns can provide crucial entry points into emerging trends. Learning to identify and trade such patterns is essential for capturing momentum and new trends.
Meaning:
Typically found in downtrends, this pattern signals a potential bullish reversal as buyers overpower sellers, often indicating a shift toward upward momentum.
BULLISH HARAMI
Bias: Bullish
What is the Bullish Harami pattern?
The Bullish Harami consists of a small bullish candle within a preceding larger bearish one, indicating a pause in downward momentum and hinting at a potential reversal. This pattern shows that sellers are beginning to weaken as buyers cautiously test the waters. The Harami reflects a shift in sentiment from bearish to neutral, often marking a transitional phase in the market.
Interpreting the Bullish Harami helps traders spot moments when sentiment is shifting, potentially signaling the start of a trend change.
Meaning:
Seen in downtrends, it suggests indecision, with possible bullish reversal if the following candles confirm buying strength, indicating a weakening bearish trend.
PIERCING LINE
Bias: Bullish
What is the Piercing Line pattern?
The Piercing Line forms when a bullish candle opens below the previous bearish candle’s low but closes over halfway into it. Found in downtrends, this pattern reflects strong buying pressure as buyers step in at lower prices, creating a potential bullish reversal. The Piercing Line pattern suggests that sentiment may be shifting as buyers gain confidence.
This pattern’s strength lies in its psychological impact, revealing moments when buyers are willing to take risks. Recognizing these signs early can provide valuable insights for traders looking to time entries.
Meaning:
Found in downtrends, this pattern suggests a possible bullish reversal if buying continues, as sellers lose control to buyers.
TWEEZER BOTTOM
Bias: Bullish
What is the Tweezer Bottom pattern?
The Tweezer Bottom pattern is characterized by two consecutive candles with nearly identical lows, one bearish and one bullish. This pattern often signals the end of a downtrend, as the matching lows suggest a strong support level where buyers are stepping in. The Tweezer Bottom highlights market psychology at work, with sellers unable to push prices lower, reflecting renewed buying interest.
Tweezer Bottoms are ideal for traders looking to identify support zones and potential reversal points. By understanding this pattern’s significance, traders can make informed decisions.
Meaning:
Found in downtrends, it signals potential reversal, showing strong support at the matching low, suggesting buyers are stepping in.
BEARISH KICKER
Bias: Bearish
What is the Bearish Kicker pattern?
The Bearish Kicker is the inverse of the Bullish Kicker, forming when a strong bearish candle follows a bullish one without overlap, indicating a sharp sentiment shift. This pattern often marks a sudden reversal, with sellers taking control after an initial bullish period. Psychologically, Bearish Kickers are powerful, signaling that buyers are caught off-guard and losing momentum.
Recognizing Bearish Kickers provides traders with insights into sudden shifts in market dynamics, helping them avoid buying into weakening trends.
Meaning:
Found after uptrends; indicates a sudden sentiment shift, signaling potential trend reversal and intensified selling pressure.
BEARISH ENGULFING
Bias: Bearish
What is the Bearish Engulfing pattern?
The Bearish Engulfing pattern forms when a large bearish candle engulfs the previous smaller bullish candle, suggesting a potential reversal in an uptrend. This pattern signals that sellers have regained control, often marking the start of downward momentum. The Bearish Engulfing reveals a psychological shift, as selling pressure overtakes buying interest.
This pattern is a powerful tool for traders who aim to catch trend reversals, allowing them to align with emerging downward momentum.
Meaning:
Typically found in uptrends, this pattern signals a potential bearish reversal as sellers overpower buyers, often indicating a downward momentum shift.
BEARISH HARAMI
Bias: Bearish
What is the Bearish Harami pattern?
The Bearish Harami consists of a small bearish candle contained within a larger preceding bullish one, reflecting indecision and a potential trend reversal. Found in uptrends, it hints that buyers are losing strength, while sellers are cautiously testing the market. This pattern highlights moments when buyer momentum begins to wane, suggesting caution.
Interpreting the Bearish Harami allows traders to spot potential shifts in sentiment, helping them manage risk and time their exits.
Meaning:
Seen in uptrends, it suggests indecision with a potential bearish reversal if following candles confirm, indicating a weakening bullish trend.
DARK CLOUD COVER
Bias: Bearish
What is the Dark Cloud Cover pattern?
The Dark Cloud Cover appears when a bearish candle opens above the previous bullish candle but closes over halfway into it, reflecting a shift in control from buyers to sellers. This pattern suggests that bullish momentum may be fading, hinting at a potential reversal. Dark Cloud Cover patterns reveal moments when sentiment shifts from optimism to caution.
For traders, understanding this pattern helps them anticipate reversals at the top of uptrends.
Meaning:
Found in uptrends; signals potential bearish reversal if selling continues, as buyers lose control to sellers.
TWEEZER TOP
Bias: Bearish
What is the Tweezer Top pattern?
The Tweezer Top is formed by two candles with matching or nearly matching highs, typically one bullish and one bearish. This pattern signals potential resistance, as sellers are consistently pushing back against the same level. The Tweezer Top reflects a moment of seller strength, often marking the end of an uptrend.
Recognizing Tweezer Tops helps traders spot resistance zones and potential reversal points, allowing them to avoid buying into weakening trends or even shorting the asset.
Meaning:
Found in uptrends, it signals potential reversal, showing strong resistance at the matching high, suggesting selling pressure.
🧭 Final Thought
Two-candle formations often appear at key turning points — right where most traders hesitate or get trapped.
Learn to read them not just as patterns, but as conversations between candles — one pushing, the other reacting.
And if this is your first time reading the series, don’t miss Part One – where we covered single-candle signals like dojis, hammers, and marubozus — the very foundations of candlestick reading.
📈 Forex & XAU/USD Channel:
t.me/intradaytradingsignals
💎 Crypto Channel:
t.me/FanCryptocurrency
Related publications
Disclaimer
The information and publications are not meant to be, and do not constitute, financial, investment, trading, or other types of advice or recommendations supplied or endorsed by TradingView. Read more in the Terms of Use.