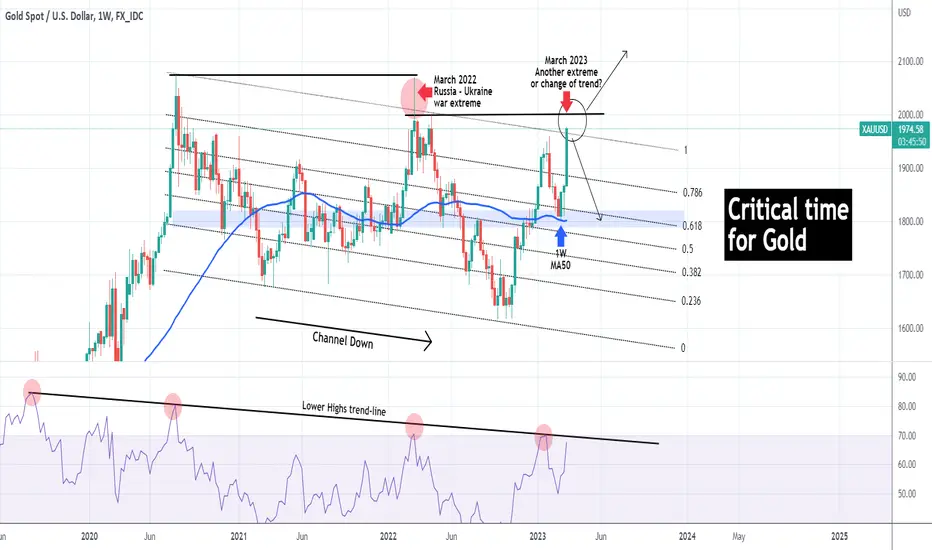
Gold (XAUUSD) is on an extreme rally since its rebound on the 1W MA50 (blue trend-line) that filled today the 1960 High of February 02. At the same time it broke above the top (Lower Highs trend-line) of the multi-year Channel Down pattern that Gold has been trading in since August 2020.
The last time it broke above this Channel was almost exactly 1 year ago (March 2022) during the peak of tension in the Russia - Ukraine war. That extreme effect only lasted for a week and the candle's wick almost reached the previous High (August 2020) before closing the 1W candle back inside the Channel Down.
With the week almost over, it is likely that this time Gold won't close the candle back inside the Channel. The previous High is exactly at 2000 so based on the extreme variance, the model can tolerate a rise up to that level.
Notice how the 1W RSI is also approaching a Lower Highs trend-line that dates back to August 19 2019! The question now that arises is does a 1W candle close above the Channel Down constitute another extreme like the war 1 year ago or is a change of trend/ pattern long-term, especially if the RSI breaks above its Lower Highs?
-------------------------------------------------------------------------------
** Please LIKE 👍, FOLLOW ✅, SHARE 🙌 and COMMENT ✍ if you enjoy this idea! Also share your ideas and charts in the comments section below! **
-------------------------------------------------------------------------------
💸💸💸💸💸💸
👇 👇 👇 👇 👇 👇
👑Best Signals (Forex/Crypto+70% accuracy) & Account Management (+20% profit/month on 10k accounts)
💰Free Channel t.me/tradingshotglobal
🤵Contact info@tradingshot.com t.me/tradingshot
🔥New service: next X100 crypto GEMS!
💰Free Channel t.me/tradingshotglobal
🤵Contact info@tradingshot.com t.me/tradingshot
🔥New service: next X100 crypto GEMS!
Disclaimer
The information and publications are not meant to be, and do not constitute, financial, investment, trading, or other types of advice or recommendations supplied or endorsed by TradingView. Read more in the Terms of Use.