Gold is currently trading around 3,337 USD, having tested the 3,350 USD resistance zone without a successful breakout. The price remains under pressure from key macroeconomic factors:
- The Dollar Index (DXY) is stable above 106 – a sign of continued demand for the greenback, which weakens gold.
- U.S. 10-year Treasury yields hold around 4.35%, reinforcing the view that the Fed will keep interest rates high.
- The Core PCE report for June remains above the Fed’s 2% inflation target, decreasing expectations of a rate cut in Q3.
- Safe-haven demand is weak, as geopolitical tension in the Middle East and Eastern Europe remains subdued.
➡ Overall, these factors confirm that XAUUSD remains under bearish pressure in both the short and medium term, especially while key resistance remains intact.
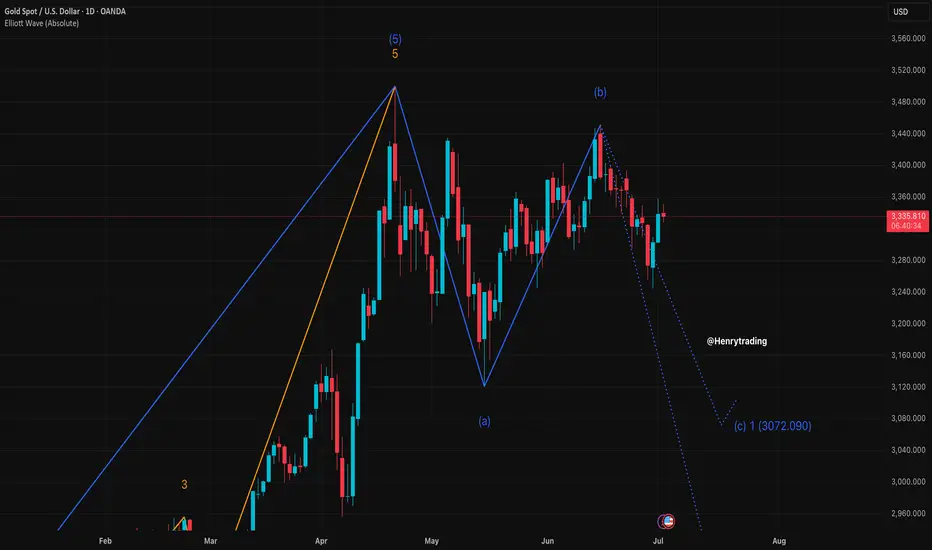
1. Technical Analysis – XAUUSD on D1 Chart
- Price recently tested the 3,340 – 3,350 USD resistance zone, a confluence of:
Previous supply zone
- Fibonacci retracement 0.5–0.618 from 3,399 USD
- Key Change of Character (CHoCH) level
- RSI is forming a mild bearish divergence, signaling weakening bullish momentum.
- EMA20 and EMA50 are both sloping downward – confirming the prevailing bearish trend.
This setup is typical of a Sell on Rally pattern, with each retracement being rejected at strong resistance.
2. Key Technical Zones to Watch
Technical Role
- 3,350 – 3,340 Major resistance (Fibo 0.5–0.618 + supply + CHoCH)
- 3,294 – 3,285 Nearest support – previously a resistance-turned-support
- 3,255 – 3,235 Short-term target zone – June low
- 3,223 – 3,205 Strong medium-term support – April low + extended Fibo
3. Suggested Trade Setup
Preferred Scenario: SELL below 3,350
Entry: 3,345 – 3,347
Stop Loss: 3,351
Take Profit 1: 3,335
Take Profit 2: 3,330
Take Profit 3: 3,320
Ps : XAUUSD is retesting a major resistance zone without macro or technical catalysts for a sustained breakout. The best approach remains to sell at resistance and take profit near support, in alignment with the ongoing bearish trend.
The strategy will be updated regularly – don’t forget to save and follow to stay ahead of market opportunities.
The analysis was provided by Henrybillion
- The Dollar Index (DXY) is stable above 106 – a sign of continued demand for the greenback, which weakens gold.
- U.S. 10-year Treasury yields hold around 4.35%, reinforcing the view that the Fed will keep interest rates high.
- The Core PCE report for June remains above the Fed’s 2% inflation target, decreasing expectations of a rate cut in Q3.
- Safe-haven demand is weak, as geopolitical tension in the Middle East and Eastern Europe remains subdued.
➡ Overall, these factors confirm that XAUUSD remains under bearish pressure in both the short and medium term, especially while key resistance remains intact.
1. Technical Analysis – XAUUSD on D1 Chart
- Price recently tested the 3,340 – 3,350 USD resistance zone, a confluence of:
Previous supply zone
- Fibonacci retracement 0.5–0.618 from 3,399 USD
- Key Change of Character (CHoCH) level
- RSI is forming a mild bearish divergence, signaling weakening bullish momentum.
- EMA20 and EMA50 are both sloping downward – confirming the prevailing bearish trend.
This setup is typical of a Sell on Rally pattern, with each retracement being rejected at strong resistance.
2. Key Technical Zones to Watch
Technical Role
- 3,350 – 3,340 Major resistance (Fibo 0.5–0.618 + supply + CHoCH)
- 3,294 – 3,285 Nearest support – previously a resistance-turned-support
- 3,255 – 3,235 Short-term target zone – June low
- 3,223 – 3,205 Strong medium-term support – April low + extended Fibo
3. Suggested Trade Setup
Preferred Scenario: SELL below 3,350
Entry: 3,345 – 3,347
Stop Loss: 3,351
Take Profit 1: 3,335
Take Profit 2: 3,330
Take Profit 3: 3,320
Ps : XAUUSD is retesting a major resistance zone without macro or technical catalysts for a sustained breakout. The best approach remains to sell at resistance and take profit near support, in alignment with the ongoing bearish trend.
The strategy will be updated regularly – don’t forget to save and follow to stay ahead of market opportunities.
The analysis was provided by Henrybillion
🪙 JOIN OUR FREE TELEGRAM GROUP 🪙
t.me/dnaprofits
Join the community group to get support and share knowledge!
️🥇 Exchange and learn market knowledge
️🥇 Support free trading signals
t.me/dnaprofits
Join the community group to get support and share knowledge!
️🥇 Exchange and learn market knowledge
️🥇 Support free trading signals
Related publications
Disclaimer
The information and publications are not meant to be, and do not constitute, financial, investment, trading, or other types of advice or recommendations supplied or endorsed by TradingView. Read more in the Terms of Use.