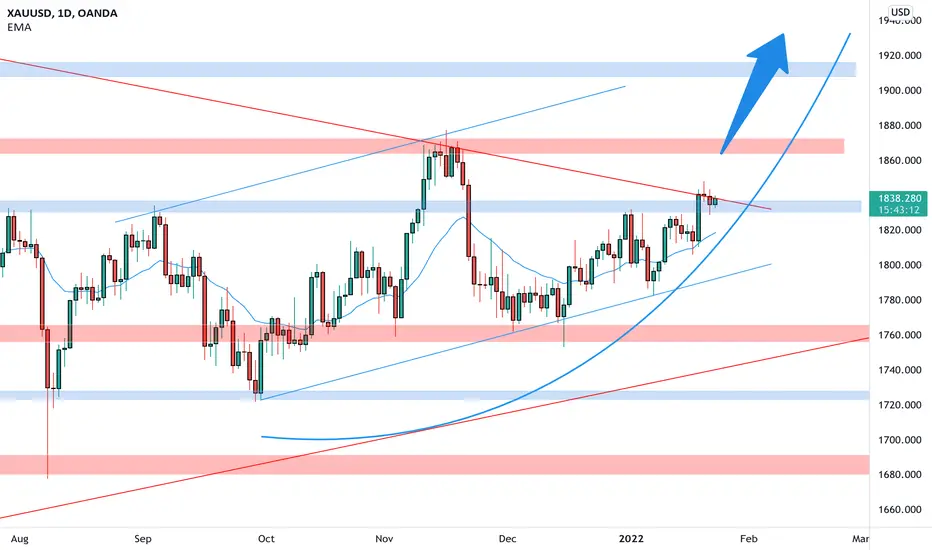
GOLD on the daily chart is testing a resistance level at the 1830 area with last week's candle closure that shows some bullish price action on the metal compartment.
Silver and Platinum moved higher too and the gold correction phase could be to an end.
The price in fact is moving into a weekly descending channel starting from the all-time highs above 2000 reached in August 2020.
How can we approach this scenario?
The bull pressure on the confluence zone between the descending trendline (red) and the daily resistance (blue) can increase during this week and a break above that area will be a sign of strength.
We will monitor the price after the break and consider a long order if our Academy rules will be satisfied.
--––
Follow the Shrimp 🦐
Keep in mind.
🟣 Purple structure -> Monthly structure.
🔴 Red structure -> Weekly structure.
🔵 Blue structure -> Daily structure.
🟡 Yellow structure -> 4h structure.
⚫️ Black structure -> <4h structure.
Here is the Plancton0618 technical analysis , please comment below if you have any questions.
The ENTRY in the market will be taken only if the condition of the Plancton0618 strategy will trigger
Note
Note
Note
Disclaimer
The information and publications are not meant to be, and do not constitute, financial, investment, trading, or other types of advice or recommendations supplied or endorsed by TradingView. Read more in the Terms of Use.
Disclaimer
The information and publications are not meant to be, and do not constitute, financial, investment, trading, or other types of advice or recommendations supplied or endorsed by TradingView. Read more in the Terms of Use.