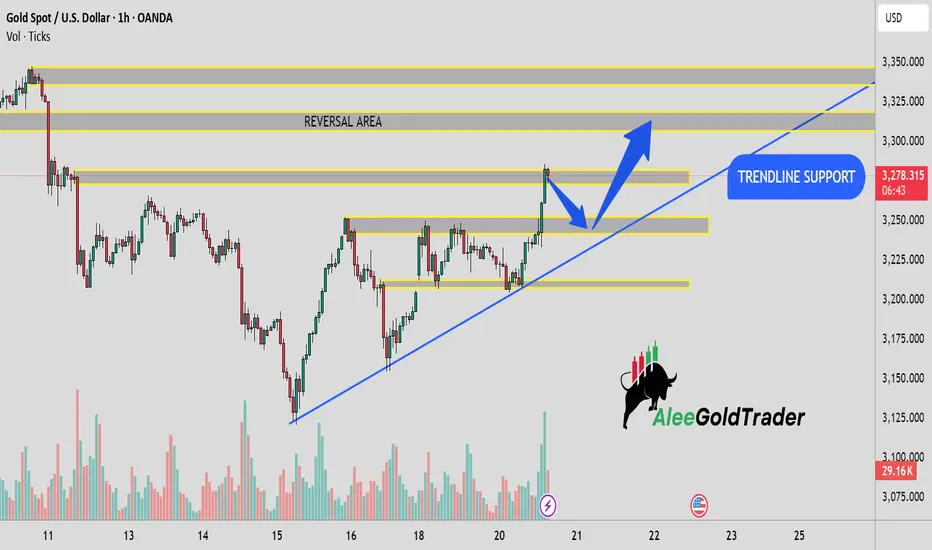
This 1-hour chart of Gold Spot (XAU/USD) shows a strong bullish trend supported by an ascending trendline. Price has recently broken above a key resistance level and is now approaching a marked Reversal Area. A pullback towards the highlighted trendline support and horizontal zone (~3,250) is anticipated before a potential continuation upwards. The chart suggests bullish momentum remains intact as long as the price holds above trendline support. Watch for price action confirmation near the support zone for potential long opportunities.
Trade closed: target reached
ALHAMDULILLAH TARGET REACHED....Daily XAU/USD FREE setups | Let's grow together!
| XAU/USD Trader | Telegram: https://t.me/Aleegoldsignals
| XAU/USD Trader | Telegram: https://t.me/Aleegoldsignals
Disclaimer
The information and publications are not meant to be, and do not constitute, financial, investment, trading, or other types of advice or recommendations supplied or endorsed by TradingView. Read more in the Terms of Use.
Daily XAU/USD FREE setups | Let's grow together!
| XAU/USD Trader | Telegram: https://t.me/Aleegoldsignals
| XAU/USD Trader | Telegram: https://t.me/Aleegoldsignals
Disclaimer
The information and publications are not meant to be, and do not constitute, financial, investment, trading, or other types of advice or recommendations supplied or endorsed by TradingView. Read more in the Terms of Use.