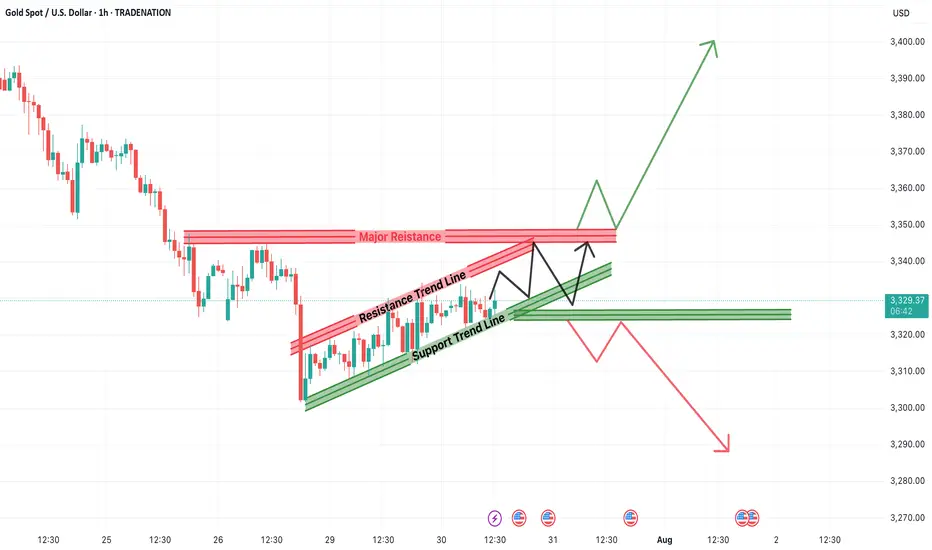
Gold has been trading within a defined rising channel pattern, forming a short-term consolidation phase after a significant bearish leg. The current setup presents a critical inflection zone where Gold (XAUUSD) could either break out above the resistance trendline and major resistance zones or retrace and resume the prior downtrend.
Traders and investors should pay close attention to the price behavior around these key levels for possible high-probability trading opportunities.
📊 Technical Breakdown
1. Rising Channel Pattern
Gold has been bouncing between a support trend line and a resistance trend line, forming a rising channel. This indicates a controlled upward movement or short-term relief within a broader downtrend.
This pattern represents a state of consolidation and indecision, often preceding a strong breakout in either direction.
2. Major Resistance Zone Ahead
The region around $3,345–$3,355 is stacked with:
This zone is the make-or-break point for bulls. A successful breakout above this resistance could open the doors for a strong bullish continuation targeting levels such as:
But without a convincing close above this zone, bullish attempts may get rejected, resulting in a pullback or even breakdown.
3. Immediate Support Zone
On the downside, $3,320–$3,325 is a key short-term support level:
If this zone fails to hold, Gold could witness a strong decline, with potential targets at:
🧠 Two Scenarios for Traders
✅ Bullish Breakout Scenario:
❌ Bearish Breakdown Scenario:
📝 Final Thoughts
The XAUUSD 1H chart is setting up for a volatile move as price action coils between strong support and resistance. The rising channel within the larger downtrend makes this an ideal setup for both breakout traders and trend followers.
For bullish traders, the best entry lies above the resistance trendline, ideally after a retest. For bearish traders, a breakdown below the support line confirms downside momentum continuation.
In either direction, a clear break from this consolidation channel is likely to deliver a fast, directional move. Patience is key—wait for a clean breakout or breakdown before entering large positions.
=================================================================
Disclosure: I am part of Trade Nation's Influencer program and receive a monthly fee for using their TradingView charts in my analysis.
=================================================================
Traders and investors should pay close attention to the price behavior around these key levels for possible high-probability trading opportunities.
📊 Technical Breakdown
1. Rising Channel Pattern
Gold has been bouncing between a support trend line and a resistance trend line, forming a rising channel. This indicates a controlled upward movement or short-term relief within a broader downtrend.
- Support Trendline: Has been respected multiple times and offers a key reference point for bullish continuation.
- Resistance Trendline: Acting as a cap on the short-term rallies.
This pattern represents a state of consolidation and indecision, often preceding a strong breakout in either direction.
2. Major Resistance Zone Ahead
The region around $3,345–$3,355 is stacked with:
- Previous supply zones.
- Confluence of the channel resistance and historical price rejection.
- Psychological level near $3,350.
This zone is the make-or-break point for bulls. A successful breakout above this resistance could open the doors for a strong bullish continuation targeting levels such as:
- $3,370
- $3,390
- $3,400+
But without a convincing close above this zone, bullish attempts may get rejected, resulting in a pullback or even breakdown.
3. Immediate Support Zone
On the downside, $3,320–$3,325 is a key short-term support level:
- Aligned with the lower boundary of the channel.
- Previous breakout retest zone.
- Demand area observed in past bounces.
If this zone fails to hold, Gold could witness a strong decline, with potential targets at:
- $3,310
- $3,290
- $3,275
🧠 Two Scenarios for Traders
✅ Bullish Breakout Scenario:
- Trigger: Price breaks above $3,355 and sustains.
- Retest Opportunity: If price comes back to test the breakout zone with a bullish engulfing candle or pin bar, it can serve as confirmation.
- Target Zones: $3,370 / $3,390 / $3,400+
- Stop Loss: Below the breakout point or recent higher low inside the channel (~$3,320)
❌ Bearish Breakdown Scenario:
- Trigger: Breakdown of the support trendline and close below $3,320.
- Confirmation: A bearish retest or continuation candle adds strength to the setup.
- Target Zones: $3,310 / $3,290 / $3,275
- Stop Loss: Above $3,335 (recent high)
📝 Final Thoughts
The XAUUSD 1H chart is setting up for a volatile move as price action coils between strong support and resistance. The rising channel within the larger downtrend makes this an ideal setup for both breakout traders and trend followers.
For bullish traders, the best entry lies above the resistance trendline, ideally after a retest. For bearish traders, a breakdown below the support line confirms downside momentum continuation.
In either direction, a clear break from this consolidation channel is likely to deliver a fast, directional move. Patience is key—wait for a clean breakout or breakdown before entering large positions.
=================================================================
Disclosure: I am part of Trade Nation's Influencer program and receive a monthly fee for using their TradingView charts in my analysis.
=================================================================
📈 Trade Smarter with TradZoo!
🔗 Website: bit.ly/tradzoopage
📣 Telegram: t.me/tradzooIndex
📲 Android App: bit.ly/TradZooApp
📲 Forex App:tradzoo.com/forex/download
🍎 iOS App: bit.ly/TradZoo-iOS-App
🔗 Website: bit.ly/tradzoopage
📣 Telegram: t.me/tradzooIndex
📲 Android App: bit.ly/TradZooApp
📲 Forex App:tradzoo.com/forex/download
🍎 iOS App: bit.ly/TradZoo-iOS-App
Disclaimer
The information and publications are not meant to be, and do not constitute, financial, investment, trading, or other types of advice or recommendations supplied or endorsed by TradingView. Read more in the Terms of Use.