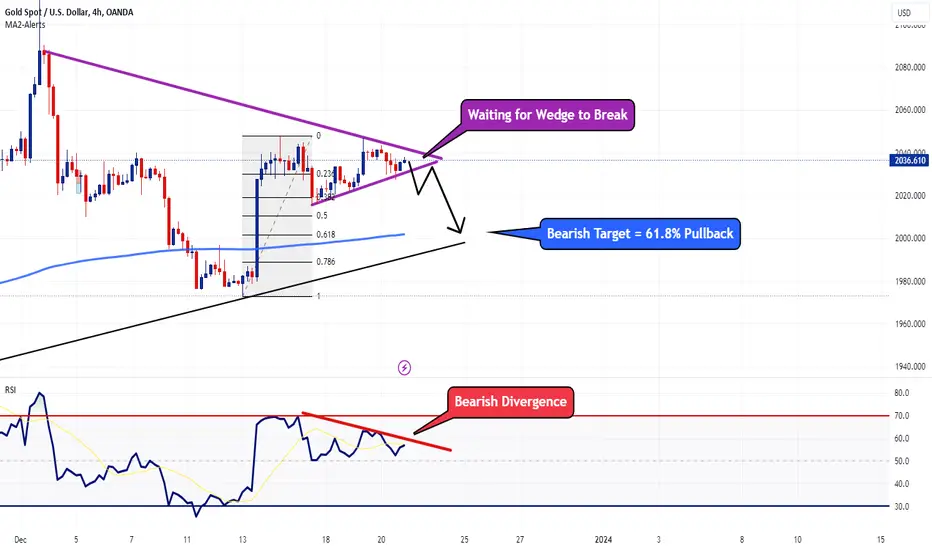
Taking a look at the 4 hour chart above, we can see price action is trading within a wedge. I'm now just waiting for a breakout whether it's above or below. My intuition tells me, a breakdown to the downside is more likely with the bearish divergence clue were getting with RSI.
Should we get a bearish breakout, I'll wait for a retest of the wedge support which will turn resistance to then target the 200 SMA which might line up with the 61.8% Fib pullback level.
Should we get a bearish breakout, I'll wait for a retest of the wedge support which will turn resistance to then target the 200 SMA which might line up with the 61.8% Fib pullback level.
Disclaimer
The information and publications are not meant to be, and do not constitute, financial, investment, trading, or other types of advice or recommendations supplied or endorsed by TradingView. Read more in the Terms of Use.
Disclaimer
The information and publications are not meant to be, and do not constitute, financial, investment, trading, or other types of advice or recommendations supplied or endorsed by TradingView. Read more in the Terms of Use.