Gold Price Movement: Initially, gold underwent a downward correction following a recent rally but then reversed its course, moving toward the $2,000 level. This suggests ongoing interest from buyers in establishing long positions.
Moving Averages: On the daily chart, the 20-period Simple Moving Average (SMA) has turned upward, indicating a bullish trend. It is situated below longer-term moving averages.
Technical Indicators: Technical indicators on the daily chart are in overbought territory, but they have only slightly retreated from recent highs. This suggests that a significant decline is not confirmed.
Short-Term Outlook: The 4-hour chart indicates a positive bias, even though momentum has decreased. XAU/USD is trading above its moving averages, with the 20-period SMA providing intraday support.
Market Dynamics: Demand for safe-haven assets like gold and the US Dollar has lessened, possibly due to ongoing developments in the Middle East, including Israel's ground offensive in the Gaza Strip.
Upcoming Events: Market participants are closely monitoring central bank announcements. The Federal Reserve, Bank of Japan, and Bank of England are all set to make announcements in the upcoming week. There are rumors that the Bank of Japan may make changes to its yield-curve control policy.
US Employment Data: The US is scheduled to release the October Nonfarm Payrolls report soon, a crucial economic indicator that can significantly impact market sentiment.
Stock Markets and Treasury Yields: Stock markets are trading positively, and Treasury yields are rising. However, these factors have not provided robust support for the US Dollar.
Note
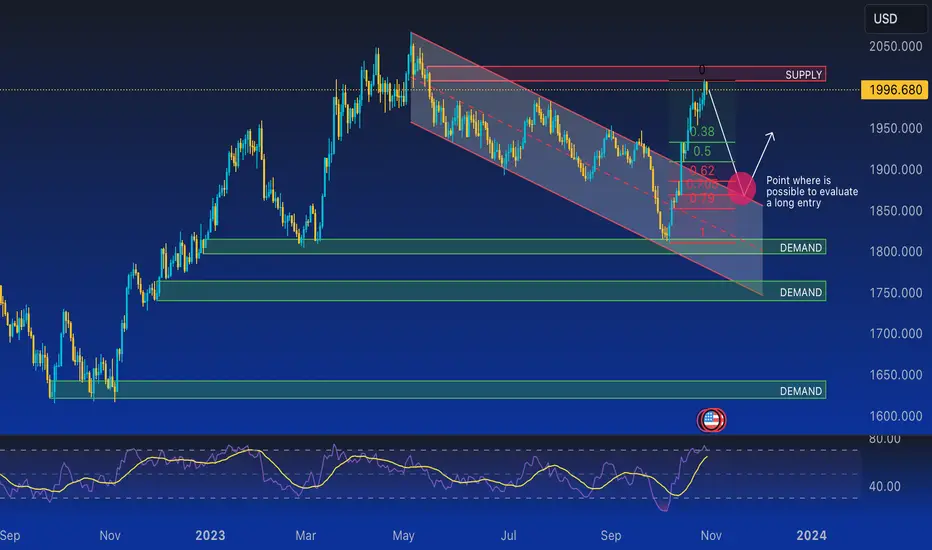
The price of gold has lost momentum and dropped below $2,000 after rising above that level in the European session. Ahead of the CB Consumer Confidence Index data from the US, the US Dollar remains resilient against its rivals, making it difficult for XAU/USD to extend higher. From a technical perspective, the Relative Strength Index (RSI) on the daily chart has moved away from overbought territory and supports the prospects for some dip-buying around the gold price. Therefore, any further decline is more likely to find support near the horizontal resistance level of $1,986-1,985. A convincing break, however, could trigger some technical selling and drag XAU/USD further towards the intermediate support of $1,964, heading towards last week's low in the $1,954-1,953 region.On the flip side, the $2,000 round figure, followed by the multi-month top around the $2,005 area touched last Friday, now appears to act as immediate hurdles. Sustained strength beyond this should pave the way for an extension of a three-week-old bullish trend and lift the gold price to the next relevant barrier near the $2,022 region.
The gold price (XAU/USD) reverses an intraday dip to the $1,990 area and climbs to a fresh daily peak during the early part of the European session. However, the precious metal remains below the psychological mark of $2,000 amid expectations that the Federal Reserve (Fed) will keep the door open for one additional rate hike in 2023 to bring inflation back to its 2% target. The hawkish outlook remains supportive of elevated US Treasury bond yields, which helps revive the demand for the US Dollar (USD) and might cap the non-yielding yellow metal.
Apart from this, Israel's more measured approach to its incursion into Gaza has eased fears about a broadening crisis in the Middle East and further undermines the safe-haven gold price. That said, the risk of a further escalation in the Israel-Hamas conflict remains, which, along with the uncertainty over the economic recovery in China, assists XAU/USD in attracting some dip-buying near the $1,990 region. The emergence of some dip-buying, meanwhile, warrants some caution before positioning for any meaningful corrective decline.
Traders might also opt to remain on the sidelines ahead of a two-day FOMC monetary policy meeting, starting this Tuesday. The Fed is scheduled to announce its decision on Wednesday and is widely anticipated to hold interest rates steady in a range of 5.25%-5.50%, or the highest in 22 years. Hence, investors will look for cues about the future rate-hike path, which, in turn, will influence the USD and provide a fresh directional impetus to the gold price. In the meantime, Tuesday's US macro data might provide some impetus.
📈 Nicola | EdgeTradingJourney
Documenting my path to $1M in prop capital through real trading, discipline, and analysis.
Documenting my path to $1M in prop capital through real trading, discipline, and analysis.
Disclaimer
The information and publications are not meant to be, and do not constitute, financial, investment, trading, or other types of advice or recommendations supplied or endorsed by TradingView. Read more in the Terms of Use.