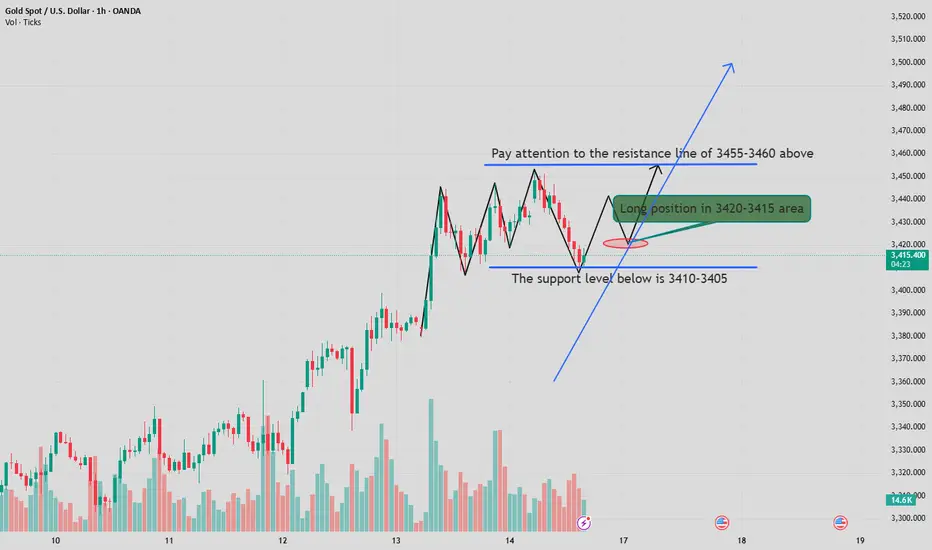
Technically, the daily level reminds us to focus on the key resistance range of 3455-3460: if this area fails to break through effectively, the price may face a technical correction; if it breaks through, it may open up further upward space. The 4-hour period chart analysis shows that the gold price maintains a unilateral upward trend, the Bollinger Band channel continues to expand, and the moving average system maintains a complete long arrangement. Two major support levels need to be monitored this week: 3420 constitutes a short-term long-short watershed, and if this position is maintained, the price will maintain its strong characteristics; 3410-3405 is a key trend support level. If it is not effectively broken, the long structure will continue.
Operation strategy:
1. It is recommended to buy gold near 3420-3415, stop loss at 3407, and target 3440-3460
Operation strategy:
1. It is recommended to buy gold near 3420-3415, stop loss at 3407, and target 3440-3460
FREE SIGNALS TECHNICAL CHART AND EDUCATION
t.me/+fSjRQ0s6m500NzVk
t.me/+fSjRQ0s6m500NzVk
Disclaimer
The information and publications are not meant to be, and do not constitute, financial, investment, trading, or other types of advice or recommendations supplied or endorsed by TradingView. Read more in the Terms of Use.