Gold (XAUUSD) Market Outlook: Bullish Trend, Critical Resistance, and Macro Drivers
Technical Analysis:
Looking at the daily timeframe, Gold has been absolutely on fire.
Overall Trend and Market Structure:
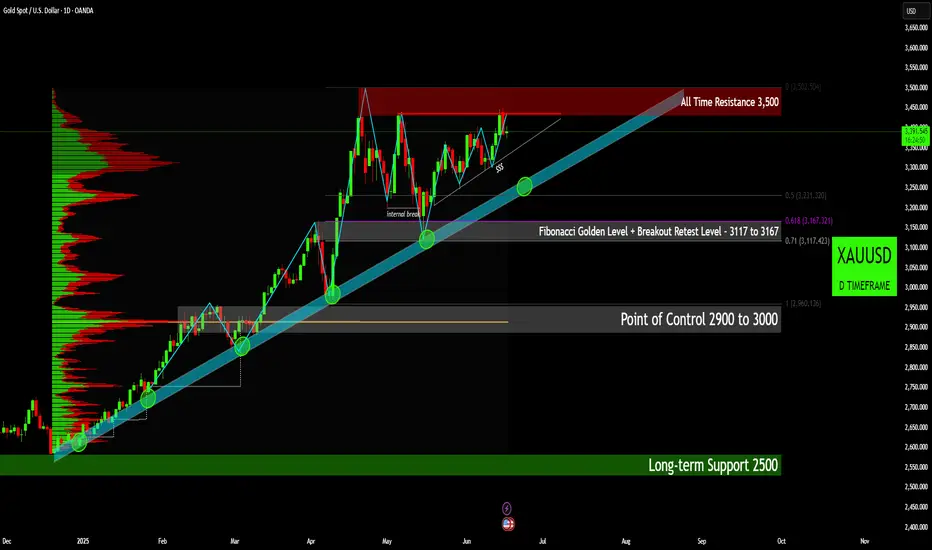
• Strong Uptrend: We've seen a remarkably robust and sustained uptrend for Gold since late 2024. It's a textbook example of a healthy rally, consistently printing higher highs and higher lows. This bullish momentum is clear as day, with the candles comfortably riding above that rising blue trendline channel.
• Trendline Support: That prominent blue diagonal band has been a fantastic dynamic support. Gold has bounced off this trendline multiple times (you can spot those green circles), which really solidifies its strength and confirms it as a key support level for this rally.
Key Resistance Level:
• All Time Resistance 3,500: Gold's currently bumping up against a major hurdle: its "All Time Resistance" zone right around 3,500, marked in red. This isn't just a number; it's a huge psychological and technical barrier. Price has poked at this level a few times lately, suggesting there's some serious selling pressure or profit-taking happening up there. A clean, decisive break and close above 3,500 would be a massive bullish signal, likely opening the door to new, uncharted price discovery.
Key Support Levels:
• Fibonacci Golden Level + Breakout Retest Level (3117 to 3167): Now, if we see a pullback, this grey rectangular zone looks like a crucial area of confluence for support.
o Fibonacci Golden Level: This zone perfectly aligns with the 0.618 and 0.71 Fibonacci retracement levels (pulled from that big swing up from the initial low). These are well-known as powerful support and resistance points.
o Breakout Retest: What makes it even stronger is the idea of a "breakout retest." It suggests a previous resistance level that Gold powered through is now expected to act as solid support if tested from above. It’s a classic chart pattern we always look for.
o This entire zone is definitely a critical area to watch if price starts correcting. A strong bounce from here would keep the bullish structure perfectly intact, but a break below it would signal a deeper correction.
• Point of Control (2900 to 3000): This broader grey zone, with the orange line highlighting the exact Point of Control (POC), tells us where the most trading volume occurred over this period (check out the Volume Profile on the left). It's a high-liquidity zone, meaning a lot of buyers and sellers found agreement there in the past. If Gold were to see a more significant correction, this area would likely offer very robust support, simply because so many market participants have a vested interest at these levels.
Volume Profile:
• Glancing at the volume profile on the left, it neatly shows us where the trading action has been heaviest. The big hump around 2900-3000, marked as the "Point of Control," really emphasizes just how important that support area is. What's interesting is the relatively lower volume as we've moved higher, suggesting less resistance on the way up. But if we fall back towards the POC, expect to see trading activity really pick up again.
Price Action & Candlestick Patterns:
• The candlestick patterns consistently show powerful bullish pushes followed by more measured pullbacks. Right now, near the All-Time Resistance, we're seeing some consolidation or perhaps a bit of indecision. The bulls are certainly trying to push through, but they're clearly meeting some stiff resistance.
• That "$" label near the trendline? That often points to areas where liquidity, like clusters of stop-losses or pending orders, might have been "swept" by larger players – a concept often discussed in Smart Money Concepts (SMC).
________________________________________
Fundamental Factors & Macro Impact:
This strong, persistent bullish trend in Gold isn't just random; it's being supercharged by a mix of powerful fundamental and macroeconomic forces:
1. Safe-Haven Demand:
o Geopolitical Tensions: Look around the world – ongoing conflicts like the Russia-Ukraine war and Middle East tensions, plus general geopolitical instability, are sending investors straight to safe havens like gold. It's seen as the ultimate store of value when the world feels unpredictable.
o Economic Uncertainty: There’s a lingering sense of unease about the global economy, whispers of potential recessions, and general market volatility. All of this naturally increases gold's appeal.
o Banking Sector Stability: Any fresh concerns about the health of the financial system or regional banking troubles can instantly boost gold's allure as a secure asset.
2. Inflation Hedge:
o While inflation has eased a bit from its peak, it's still proving quite stubborn in many major economies, higher than what central banks would prefer. Gold has a long history as a reliable hedge against inflation; it tends to hold its value or even increase when fiat currencies lose purchasing power.
3. Central Bank Buying Spree:
o This is a massive, often under-appreciated, driver. Central banks, especially those in emerging markets, have been aggressively buying gold. They're looking to diversify their foreign exchange reserves away from the US Dollar, reduce their reliance on Western financial systems, and simply add another layer of protection against global risks. This consistent, institutional demand provides a very strong underlying bid for gold.
4. Interest Rate Expectations & US Dollar Weakness:
o Federal Reserve Policy: Gold typically moves in the opposite direction of real (inflation-adjusted) interest rates and the strength of the US Dollar.
o Rate Cut Anticipation: Markets are increasingly pricing in interest rate cuts from the Federal Reserve and other major central banks. When interest rates are expected to fall, holding non-yielding gold becomes much more attractive compared to assets that pay less interest. The opportunity cost of gold goes down.
o Weaker US Dollar: A softer US Dollar makes gold cheaper for anyone holding other currencies, which naturally boosts demand. Persistent concerns about the US national debt and fiscal health can also put pressure on the dollar, thereby supporting gold.
5. Global De-dollarization Efforts:
o This also supports in terms of De-dollarization or reducing the country’s dependence on the US Dollar for international trade and as a reserve currency. Gold plays a significant role in this strategic shift, adding another layer to its demand.
________________________________________
Conclusion & Outlook:
Gold (XAUUSD) is absolutely in a powerful, well-established bullish trend, having racked up some impressive gains since late 2024. Right now, it's staring down its "All Time Resistance" at 3,500 – a truly critical moment.
• Bullish Scenario: If we see a decisive breakout and a sustained close above 3,500, it would confirm incredibly strong bullish momentum. This could easily lead to a swift move into new, uncharted territories. We'd expect this to be fueled by ongoing safe-haven demand, continued aggressive central bank buying, and/or growing conviction that significant rate cuts are on the horizon.
• Correction Scenario: On the flip side, a strong rejection from that 3,500 resistance could trigger a correction. We'd likely see it head back towards the trendline support, and possibly even that "Fibonacci Golden Level + Breakout Retest Level" zone (3117-3167). As long as these key support levels hold firm, the overall bullish structure stays perfectly intact. However, a clear break below that golden zone would signal a deeper pullback, with the "Point of Control" (2900-3000) waiting as the ultimate strong support.
From a fundamental perspective, the broader macroeconomic landscape – thinking about geopolitical tensions, persistent inflation concerns, the insatiable central bank demand, and the future path of monetary policy – continues to lean very much in gold's favor. Going forward, traders and investors will be keeping a very close eye on central bank statements, inflation reports, and any new geopolitical developments for the next big cues on Gold's direction.
Disclaimer:
The information provided in this chart is for educational and informational purposes only and should not be considered as investment advice. Trading and investing involve substantial risk and are not suitable for every investor. You should carefully consider your financial situation and consult with a financial advisor before making any investment decisions. The creator of this chart does not guarantee any specific outcome or profit and is not responsible for any losses incurred as a result of using this information. Past performance is not indicative of future results. Use this information at your own risk. This chart has been created for my own improvement in Trading and Investment Analysis. Please do your own analysis before any investments.
Technical Analysis:
Looking at the daily timeframe, Gold has been absolutely on fire.
Overall Trend and Market Structure:
• Strong Uptrend: We've seen a remarkably robust and sustained uptrend for Gold since late 2024. It's a textbook example of a healthy rally, consistently printing higher highs and higher lows. This bullish momentum is clear as day, with the candles comfortably riding above that rising blue trendline channel.
• Trendline Support: That prominent blue diagonal band has been a fantastic dynamic support. Gold has bounced off this trendline multiple times (you can spot those green circles), which really solidifies its strength and confirms it as a key support level for this rally.
Key Resistance Level:
• All Time Resistance 3,500: Gold's currently bumping up against a major hurdle: its "All Time Resistance" zone right around 3,500, marked in red. This isn't just a number; it's a huge psychological and technical barrier. Price has poked at this level a few times lately, suggesting there's some serious selling pressure or profit-taking happening up there. A clean, decisive break and close above 3,500 would be a massive bullish signal, likely opening the door to new, uncharted price discovery.
Key Support Levels:
• Fibonacci Golden Level + Breakout Retest Level (3117 to 3167): Now, if we see a pullback, this grey rectangular zone looks like a crucial area of confluence for support.
o Fibonacci Golden Level: This zone perfectly aligns with the 0.618 and 0.71 Fibonacci retracement levels (pulled from that big swing up from the initial low). These are well-known as powerful support and resistance points.
o Breakout Retest: What makes it even stronger is the idea of a "breakout retest." It suggests a previous resistance level that Gold powered through is now expected to act as solid support if tested from above. It’s a classic chart pattern we always look for.
o This entire zone is definitely a critical area to watch if price starts correcting. A strong bounce from here would keep the bullish structure perfectly intact, but a break below it would signal a deeper correction.
• Point of Control (2900 to 3000): This broader grey zone, with the orange line highlighting the exact Point of Control (POC), tells us where the most trading volume occurred over this period (check out the Volume Profile on the left). It's a high-liquidity zone, meaning a lot of buyers and sellers found agreement there in the past. If Gold were to see a more significant correction, this area would likely offer very robust support, simply because so many market participants have a vested interest at these levels.
Volume Profile:
• Glancing at the volume profile on the left, it neatly shows us where the trading action has been heaviest. The big hump around 2900-3000, marked as the "Point of Control," really emphasizes just how important that support area is. What's interesting is the relatively lower volume as we've moved higher, suggesting less resistance on the way up. But if we fall back towards the POC, expect to see trading activity really pick up again.
Price Action & Candlestick Patterns:
• The candlestick patterns consistently show powerful bullish pushes followed by more measured pullbacks. Right now, near the All-Time Resistance, we're seeing some consolidation or perhaps a bit of indecision. The bulls are certainly trying to push through, but they're clearly meeting some stiff resistance.
• That "$" label near the trendline? That often points to areas where liquidity, like clusters of stop-losses or pending orders, might have been "swept" by larger players – a concept often discussed in Smart Money Concepts (SMC).
________________________________________
Fundamental Factors & Macro Impact:
This strong, persistent bullish trend in Gold isn't just random; it's being supercharged by a mix of powerful fundamental and macroeconomic forces:
1. Safe-Haven Demand:
o Geopolitical Tensions: Look around the world – ongoing conflicts like the Russia-Ukraine war and Middle East tensions, plus general geopolitical instability, are sending investors straight to safe havens like gold. It's seen as the ultimate store of value when the world feels unpredictable.
o Economic Uncertainty: There’s a lingering sense of unease about the global economy, whispers of potential recessions, and general market volatility. All of this naturally increases gold's appeal.
o Banking Sector Stability: Any fresh concerns about the health of the financial system or regional banking troubles can instantly boost gold's allure as a secure asset.
2. Inflation Hedge:
o While inflation has eased a bit from its peak, it's still proving quite stubborn in many major economies, higher than what central banks would prefer. Gold has a long history as a reliable hedge against inflation; it tends to hold its value or even increase when fiat currencies lose purchasing power.
3. Central Bank Buying Spree:
o This is a massive, often under-appreciated, driver. Central banks, especially those in emerging markets, have been aggressively buying gold. They're looking to diversify their foreign exchange reserves away from the US Dollar, reduce their reliance on Western financial systems, and simply add another layer of protection against global risks. This consistent, institutional demand provides a very strong underlying bid for gold.
4. Interest Rate Expectations & US Dollar Weakness:
o Federal Reserve Policy: Gold typically moves in the opposite direction of real (inflation-adjusted) interest rates and the strength of the US Dollar.
o Rate Cut Anticipation: Markets are increasingly pricing in interest rate cuts from the Federal Reserve and other major central banks. When interest rates are expected to fall, holding non-yielding gold becomes much more attractive compared to assets that pay less interest. The opportunity cost of gold goes down.
o Weaker US Dollar: A softer US Dollar makes gold cheaper for anyone holding other currencies, which naturally boosts demand. Persistent concerns about the US national debt and fiscal health can also put pressure on the dollar, thereby supporting gold.
5. Global De-dollarization Efforts:
o This also supports in terms of De-dollarization or reducing the country’s dependence on the US Dollar for international trade and as a reserve currency. Gold plays a significant role in this strategic shift, adding another layer to its demand.
________________________________________
Conclusion & Outlook:
Gold (XAUUSD) is absolutely in a powerful, well-established bullish trend, having racked up some impressive gains since late 2024. Right now, it's staring down its "All Time Resistance" at 3,500 – a truly critical moment.
• Bullish Scenario: If we see a decisive breakout and a sustained close above 3,500, it would confirm incredibly strong bullish momentum. This could easily lead to a swift move into new, uncharted territories. We'd expect this to be fueled by ongoing safe-haven demand, continued aggressive central bank buying, and/or growing conviction that significant rate cuts are on the horizon.
• Correction Scenario: On the flip side, a strong rejection from that 3,500 resistance could trigger a correction. We'd likely see it head back towards the trendline support, and possibly even that "Fibonacci Golden Level + Breakout Retest Level" zone (3117-3167). As long as these key support levels hold firm, the overall bullish structure stays perfectly intact. However, a clear break below that golden zone would signal a deeper pullback, with the "Point of Control" (2900-3000) waiting as the ultimate strong support.
From a fundamental perspective, the broader macroeconomic landscape – thinking about geopolitical tensions, persistent inflation concerns, the insatiable central bank demand, and the future path of monetary policy – continues to lean very much in gold's favor. Going forward, traders and investors will be keeping a very close eye on central bank statements, inflation reports, and any new geopolitical developments for the next big cues on Gold's direction.
Disclaimer:
The information provided in this chart is for educational and informational purposes only and should not be considered as investment advice. Trading and investing involve substantial risk and are not suitable for every investor. You should carefully consider your financial situation and consult with a financial advisor before making any investment decisions. The creator of this chart does not guarantee any specific outcome or profit and is not responsible for any losses incurred as a result of using this information. Past performance is not indicative of future results. Use this information at your own risk. This chart has been created for my own improvement in Trading and Investment Analysis. Please do your own analysis before any investments.
Disclaimer
The information and publications are not meant to be, and do not constitute, financial, investment, trading, or other types of advice or recommendations supplied or endorsed by TradingView. Read more in the Terms of Use.
Disclaimer
The information and publications are not meant to be, and do not constitute, financial, investment, trading, or other types of advice or recommendations supplied or endorsed by TradingView. Read more in the Terms of Use.