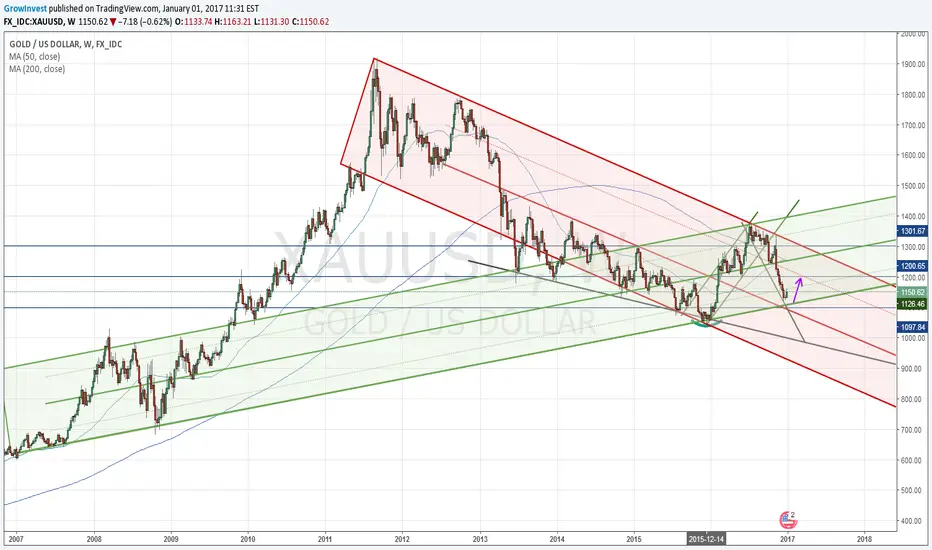
Gold may soon find its support within the descending channel, but overall trend is bearish (from 2011).
This is an update of my previous idea (see the link below).
Do not take it as a signal for opening your trading position immediately. Make your own analysis and hold your trading strategy, please.
This is an update of my previous idea (see the link below).
Do not take it as a signal for opening your trading position immediately. Make your own analysis and hold your trading strategy, please.
Note
Gold reached it´s 200 MA @ 1243 on weekly chart and is taking a rest now.Note
After second hit of 200 MA the Doji-like candle appears in an overbought area. We saw opposite candlestick pattern several weeks ago, when the trend has changed from it´s huge decline. The trend may thus reverse. Price is still above 1217-1220 level, which I am considering as an important area for further upside/downside movements. The next 1 or 2 weeks might be very important. Take care.Note
Gold is now testing the upper trendline.Note
Trendline stopped the uptrend.Note
Gold weekly view update.Related publications
Disclaimer
The information and publications are not meant to be, and do not constitute, financial, investment, trading, or other types of advice or recommendations supplied or endorsed by TradingView. Read more in the Terms of Use.
Related publications
Disclaimer
The information and publications are not meant to be, and do not constitute, financial, investment, trading, or other types of advice or recommendations supplied or endorsed by TradingView. Read more in the Terms of Use.