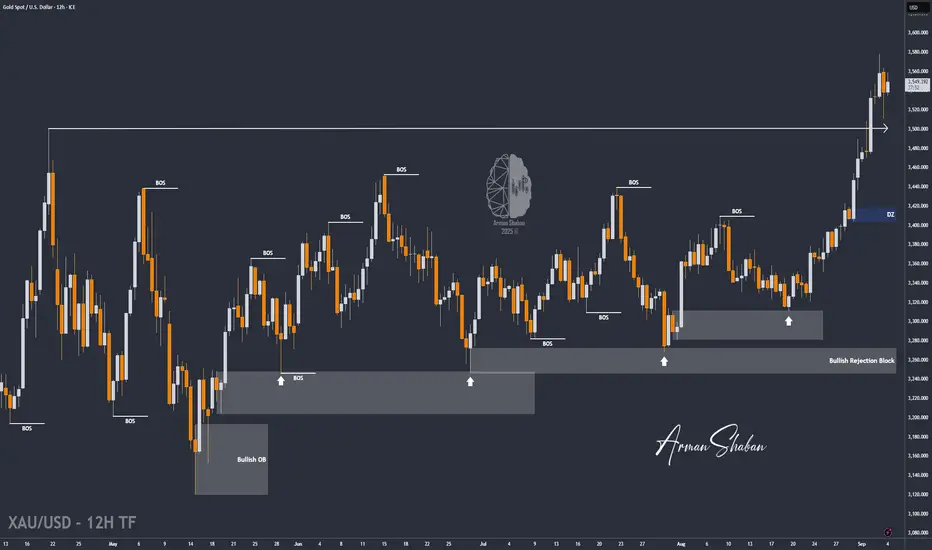
By analyzing the gold chart on the 12-hour timeframe, we can see that the price continued its rally today, reaching $3,578 and printing a new all-time high (ATH)! After hitting this level, gold made a slight pullback to $3,510. Right now, the price has bounced back and is trading around $3,550.
So far, there are no clear signs on the higher timeframes that gold is ready to reverse from here. For that, we would need to see stronger bearish moves. The current momentum still supports further upside unless proven otherwise. That’s why it’s better to stay patient and wait for a real break or shift in market structure before looking for attractive trade setups.
Also, tomorrow we have the NFP report, which could trigger a drop in gold if the data comes in stronger than expected. Until then, we’ll wait — and if you guys strongly support this post, I’ll share my updated personal analysis a few hours before the release. Stay tuned!
Please support me with your likes and comments to motivate me to share more analysis with you and share your opinion about the possible trend of this chart with me !
Best Regards , Arman Shaban
Trade active
By analyzing the gold chart on the 12-hour timeframe, we can see that the price is still trading around $3,550. Based on the signals on the chart, two key levels stand out: $3,559 is the first. If the price closes and holds below $3,559, we could expect a heavy drop. But if the price manages to close and hold above $3,559, then gold might climb toward $3,600.In just a few minutes, the NFP report will be released, and the market will likely turn very volatile. Be careful with your trades and don’t risk more than you can afford!
Note
Gold on Fire! $3,600 in Sight 🔥Well, as expected — gold is blazing its way toward $3,600, and honestly… nothing seems to be slowing it down except maybe institutional profit-taking!
🟡 After the weak NFP report and rising unemployment, the market fully embraced the rate cut narrative, and gold responded with power — hitting a fresh ATH at $3,584 just now!
Right now, price is consolidating around $3,580–$3,584, and the bullish momentum still looks intact unless we see some sharp selling from big players (banks or funds locking in profits).
📌 Personally, I’ve got my eye on a few juicy zones — both for BUY and SELL setups — and I’ll be sharing them with you very soon!
Trade closed: target reached
By analyzing the gold chart on the 12-hour timeframe, we can see that the price finally confirmed above $3,559 in line with the bullish scenario and pushed higher. On Friday, gold rallied to $3,600 before facing selling pressure that pulled it back to $3,580. Today, with the market reopening, gold continued its rally and has climbed to $3,632 so far. As I mentioned before, nothing seems to be stopping this strong bullish momentum!The weak U.S. job market data has added more pressure on the dollar, giving gold even more room to rise. With rate cuts expected this month, capital is flowing into gold, and targets above $3,700 are very realistic. Since we’re now trading at prices never seen before, we lack past technical data to project future moves, so we must wait for at least one market structure break to confirm a possible pullback to lower levels.
Stay with me step by step so we can capture the maximum profits from gold’s movements!
⚜️ Free Telegram Channel : t.me/PriceAction_ICT
⚜️ JOIN THE VIP : t.me/PriceAction_ICT/5946
⚜️ Contact Me : t.me/ArmanShabanTrading
⚜️ JOIN THE VIP : t.me/PriceAction_ICT/5946
⚜️ Contact Me : t.me/ArmanShabanTrading
Related publications
Disclaimer
The information and publications are not meant to be, and do not constitute, financial, investment, trading, or other types of advice or recommendations supplied or endorsed by TradingView. Read more in the Terms of Use.