Daily Chart
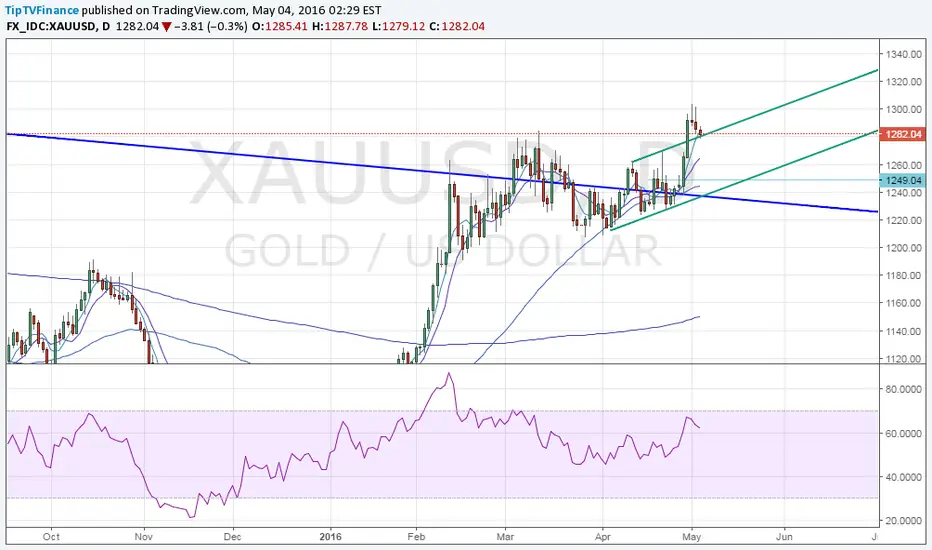
Resistance - $1287, $1300-1303, $1310
Support - $1280, $1270, $1263
Resistance - $1287, $1300-1303, $1310
Support - $1280, $1270, $1263
- Gold dipped to $1278 levels before recovering above flag resistance level of 1280 levels.
- With daily RSI sitting well above 50.00 and prices comfortably above key support level of $1263, we may see a break above $1287 (daily high).
- In such a case, prices may head higher to $1295-1300 area.
- On the downside, $1263 stands as a major support.
Disclaimer
The information and publications are not meant to be, and do not constitute, financial, investment, trading, or other types of advice or recommendations supplied or endorsed by TradingView. Read more in the Terms of Use.
Disclaimer
The information and publications are not meant to be, and do not constitute, financial, investment, trading, or other types of advice or recommendations supplied or endorsed by TradingView. Read more in the Terms of Use.