Market Structure
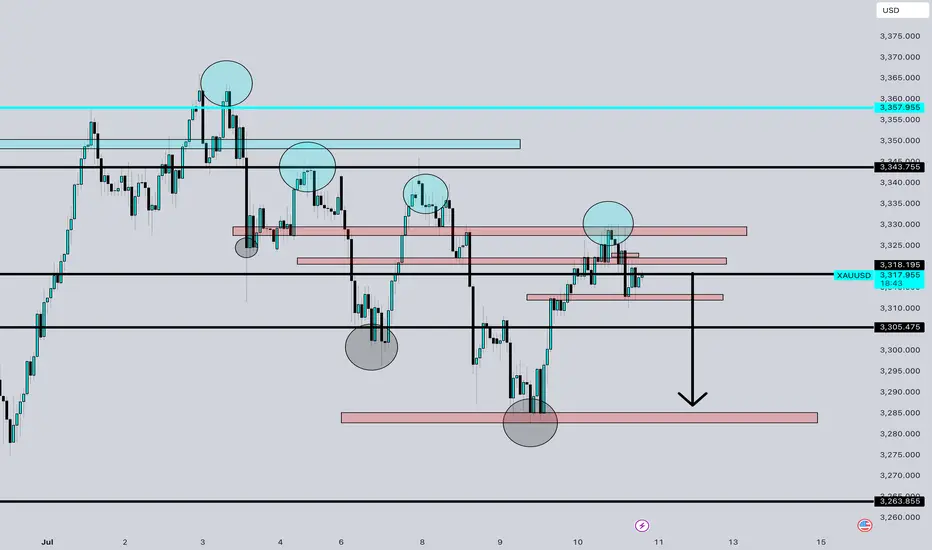
• Price has formed a clear lower high structure following the peak near 3360–3365.
• Subsequent highs (highlighted in blue circles) show consistent failure to break previous highs, indicating bearish momentum.
• The price is currently reacting from a well-defined supply zone (red box near 3325–3330), where selling pressure previously emerged.
Key Resistance Zones
• 3325–3330: This supply zone has held strong multiple times. Price failed to break above this area during the latest retest.
• 3340–3345: Previous support turned resistance, also aligns with a prior lower high.
• 3360–3365: Major resistance and recent swing high (bearish market invalidation point).
Support Zones to Target
• 3305.475: Minor support; price could consolidate here before further drop.
• 3280–3285: Key demand zone where price previously bounced.
• 3263.855: Major support level and likely final target in the short term if bearish move continues.
Confluences Supporting a Sell
• Series of lower highs (bearish structure).
• Strong supply zone rejection.
• Bearish engulfing candles around resistance.
• Clean liquidity sweep above prior highs followed by sharp rejections.
• Arrow on chart suggesting bearish projection.
Risk Consideration
• A break and strong close above 3335 would invalidate this bearish setup.
• Watch out for possible whipsaw behavior around 3305 zone before continuation.
Telegram Trading Channel - t.me/DBFXTraderChannel
Disclaimer
The information and publications are not meant to be, and do not constitute, financial, investment, trading, or other types of advice or recommendations supplied or endorsed by TradingView. Read more in the Terms of Use.
Telegram Trading Channel - t.me/DBFXTraderChannel
Disclaimer
The information and publications are not meant to be, and do not constitute, financial, investment, trading, or other types of advice or recommendations supplied or endorsed by TradingView. Read more in the Terms of Use.