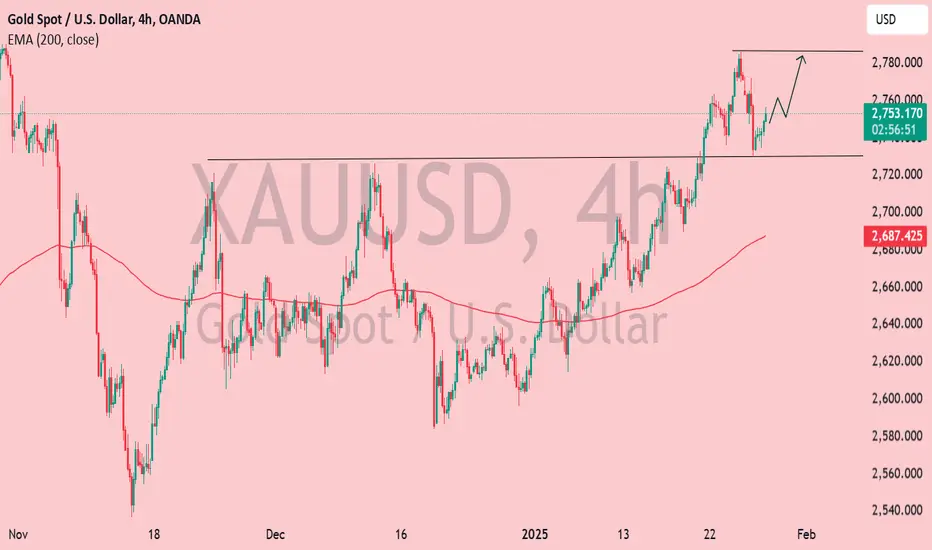
📊 XAU/USD 4H Chart Analysis – Bullish Momentum 🚀💰
📌 Key Observations:
🔹 Current Price: $2,754.16 (+0.19%)
🔹 Support Zone: $2,740 - $2,750 (Previous resistance turned support ✅)
🔹 Resistance Zone: $2,780 (Next potential target 🎯)
🔹 200 EMA: $2,687.43 (Price is above = Bullish signal 📈)
🔹 Breakout Confirmation: Price has broken past a key level and might retest before moving higher 🔄📊
📉 Potential Scenarios:
✅ Bullish Case: If price holds above $2,750, we could see a rally towards $2,780+ 🚀
❌ Bearish Case: If price drops below $2,740, we might see a correction back to $2,720 ⚠️
🔥 Conclusion:
Gold is showing strong bullish momentum and may continue its uptrend towards $2,780+ if it sustains above the breakout level! Keep an eye on support at $2,750 for confirmation. 👀💎
Would you like further indicators or a different timeframe analysis? ⏳📊
Note
GOLD moving on to the target focus on analyse Trade active
Market OverviewGold prices softened slightly on Monday, hovering just below the all-time high of $2,790.17. Despite this dip, market sentiment remains optimistic, with traders eyeing the key $3,000 milestone. However, risks of a pullback linger, with immediate support at $2,693.40. A breach of $2,735.96 could signal a shift toward bearish momentum.
U.S. Treasury yields declined as investors turned to safer assets amid a downturn in tech stocks. The 10-year yield dropped by 11 basis points to 4.514%, while the 2-year yield eased to 4.182%. The dollar index also weakened, falling 0.28% to 107.16, staying near last week’s one-month low.
The tech sell-off was fueled by concerns over valuation following the announcement of a budget-friendly AI model from China’s DeepSeek. This development heightened market uncertainty, bolstering demand for safe-haven currencies like the yen and Swiss franc, further pressuring the dollar.
Note
AUD and Gold Relationship: Gold and the Australian dollar often move in synchrony due to Australia’s status as a major gold producer. When gold prices rise, the AUD tends to strengthen, as higher gold exports boost Australia’s trade balance and currency value
Why Does the US Dollar Sometimes Move in Sync with Gold?
Exceptions:
➠ Simultaneous Safe-Haven Demand:
During times of crisis—such as political instability, economic recessions, or global uncertainty—investors often seek both the USD (as the world’s reserve currency) and gold (as a safe-haven asset). This can temporarily override their usual inverse correlation.
Example: In 2020, during the early stages of the COVID-19 pandemic, both gold prices and the US Dollar Index (DXY) spiked as investors scrambled for safety.
➠ Inflation and Fed Policy:
If inflation surges faster than interest rates can rise, gold often climbs as an inflation hedge. At the same time, the USD may strengthen due to the Federal Reserve’s rate hikes or expectations of tighter monetary policy.
Example: In 2022, gold prices increased alongside a strong USD as persistent inflation fears outweighed the dollar’s strength from Fed rate hikes.
➠ Global USD Liquidity Shortages:
In severe market stress, such as the 2008 financial crisis, investors often sell assets, including gold, to hoard cash liquidity. This can cause both gold and the DXY to fall temporarily, despite their usual dynamics.
➠ Central Bank Actions:
Aggressive gold purchases by central banks like China, Russia can prop up gold prices even if the USD is strong.
➠ Technical Breaks:
Short-term technical breaking key resistance or support levels in gold prices, can override fundamental trends. This can lead to both gold and the USD moving in the same direction temporarily.
Conclusion:
- Gold and the US dollar typically move in opposite directions. However, during times of fear, inflation concerns, or liquidity crises, this relationship can flip. When gold and the USD align, it’s often a signal of extreme market stress.
Trade closed: target reached
🚀🎯 XAU/USD Target Hit – Another Golden Achievement! 💰✨
Gold (XAU/USD) successfully reached our $2,780 target, proving once again the power of technical analysis & smart trading! ✅📊
🔹 Breakout confirmed above key resistance
🔹 Bullish momentum played out perfectly
🔹 Profits secured – Mission accomplished! 🏆💸
A big congrats to everyone who followed this trade! 🎉 Let’s stay focused for the next big opportunity! 📈🔥
#Gold #XAUUSD #TradingSuccess #BullishMomentum 🚀💎
JOIN MY TELEGRAM CHANNEL
t.me/StellarMarketAnalysis
JOIN MY RECOMMENTED BROKER REFFREL LINK
⤵️one.exnesstrack.net/a/uvd1etcgg1
PARTNER CODE⤵️
uvd1etcgg1
t.me/StellarMarketAnalysis
JOIN MY RECOMMENTED BROKER REFFREL LINK
⤵️one.exnesstrack.net/a/uvd1etcgg1
PARTNER CODE⤵️
uvd1etcgg1
Disclaimer
The information and publications are not meant to be, and do not constitute, financial, investment, trading, or other types of advice or recommendations supplied or endorsed by TradingView. Read more in the Terms of Use.
