Market News:
In early Asian trading on Thursday (August 7), spot gold prices fluctuated within a narrow range, currently trading around the 3,370 mark. International gold prices retreated slightly from a two-week high, primarily due to profit-taking by some investors, but the overall pullback was mild, indicating that bullish sentiment remained strong. The market is focused on US President Trump's upcoming announcement of his Federal Reserve nominee, a development that could profoundly impact the future path of interest rates and have a medium- to long-term impact on gold prices. Currently, while London gold prices have retreated slightly due to technical adjustments, the overall bullish structure remains intact. At the macro level, factors such as the slowdown in US service sector expansion, a cooling job market, rising business costs, and tariff uncertainty are compounding the market's heightened vigilance against stagflation and policy miscalculations. Furthermore, attention will be focused on changes in US initial jobless claims, the Bank of England's interest rate decision, and speeches by Federal Reserve officials.
Technical Analysis:
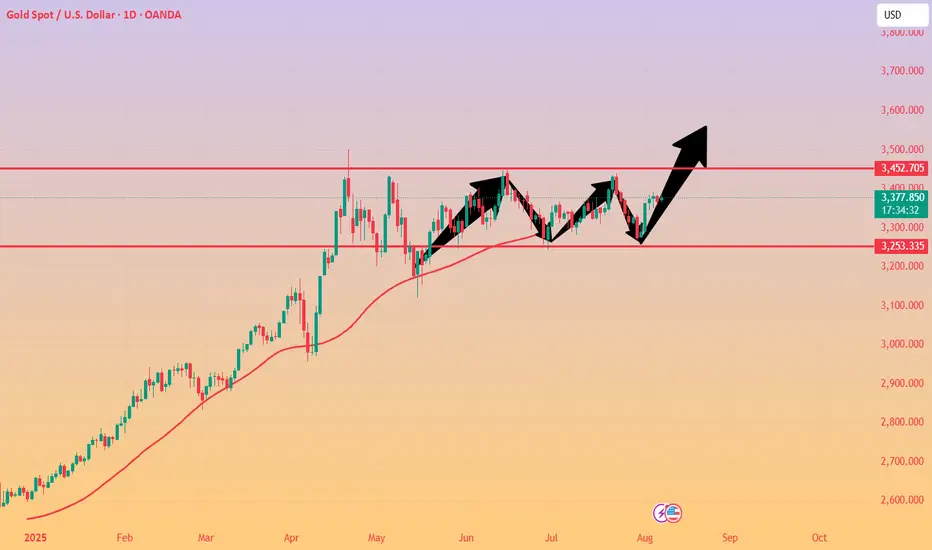
Gold prices fluctuated back and forth throughout the day. The US dollar index is declining significantly, suggesting a buy signal on the daily and weekly charts for gold. The 10/7-day moving averages are forming a golden cross and rising, the RSI indicator remains above the central axis, and the price is trading within the upper middle Bollinger Band. The Bollinger Bands on the four-hour chart are opening upwards, the moving averages are consolidating around the 70 mark, and the RSI indicator is trading above the central axis. With the US dollar's sharp decline and weakening, the key strategy for gold trading remains to buy at low prices. Don't chase highs when bullish on gold; wait for a pullback to buy. Don't speculate on the top of the rally; trade wherever the price can reach. Technically, gold has seen four consecutive days of gains on the daily chart, demonstrating strong trend strength. The upside is near the upper Bollinger Band of 3430. This price may be tested this week. A significant rally is not yet evident until the daily Bollinger Bands open up. Whether a significant rally will break through the previous high is not a matter of speculation; trade accordingly. Focus on two support levels within the short-term cycle: 3358 and 3350. After the Asian and European sessions conclude, consider placing effective buy orders based on actual conditions. We anticipate the upward trend will continue during the US session.
Trading Strategy:
Short-term gold buy at 3365-3368, stop loss at 3356, target at 3380-3400;
Short-term gold sell at 3387-3390, stop loss at 3398, target at 3360-3370;
Key Points:
First Support Level: 3365, Second Support Level: 3358, Third Support Level: 3343
First Resistance Level: 3390, Second Resistance Level: 3408, Third Resistance Level: 3420
In early Asian trading on Thursday (August 7), spot gold prices fluctuated within a narrow range, currently trading around the 3,370 mark. International gold prices retreated slightly from a two-week high, primarily due to profit-taking by some investors, but the overall pullback was mild, indicating that bullish sentiment remained strong. The market is focused on US President Trump's upcoming announcement of his Federal Reserve nominee, a development that could profoundly impact the future path of interest rates and have a medium- to long-term impact on gold prices. Currently, while London gold prices have retreated slightly due to technical adjustments, the overall bullish structure remains intact. At the macro level, factors such as the slowdown in US service sector expansion, a cooling job market, rising business costs, and tariff uncertainty are compounding the market's heightened vigilance against stagflation and policy miscalculations. Furthermore, attention will be focused on changes in US initial jobless claims, the Bank of England's interest rate decision, and speeches by Federal Reserve officials.
Technical Analysis:
Gold prices fluctuated back and forth throughout the day. The US dollar index is declining significantly, suggesting a buy signal on the daily and weekly charts for gold. The 10/7-day moving averages are forming a golden cross and rising, the RSI indicator remains above the central axis, and the price is trading within the upper middle Bollinger Band. The Bollinger Bands on the four-hour chart are opening upwards, the moving averages are consolidating around the 70 mark, and the RSI indicator is trading above the central axis. With the US dollar's sharp decline and weakening, the key strategy for gold trading remains to buy at low prices. Don't chase highs when bullish on gold; wait for a pullback to buy. Don't speculate on the top of the rally; trade wherever the price can reach. Technically, gold has seen four consecutive days of gains on the daily chart, demonstrating strong trend strength. The upside is near the upper Bollinger Band of 3430. This price may be tested this week. A significant rally is not yet evident until the daily Bollinger Bands open up. Whether a significant rally will break through the previous high is not a matter of speculation; trade accordingly. Focus on two support levels within the short-term cycle: 3358 and 3350. After the Asian and European sessions conclude, consider placing effective buy orders based on actual conditions. We anticipate the upward trend will continue during the US session.
Trading Strategy:
Short-term gold buy at 3365-3368, stop loss at 3356, target at 3380-3400;
Short-term gold sell at 3387-3390, stop loss at 3398, target at 3360-3370;
Key Points:
First Support Level: 3365, Second Support Level: 3358, Third Support Level: 3343
First Resistance Level: 3390, Second Resistance Level: 3408, Third Resistance Level: 3420
Trade active
We bought gold at 3370. Now the market price has reached our target, and we have made a profit. Next, we will analyze the next trading signal. If you need it, please contact me!Trade closed: target reached
The target has been reached, we will analyze the next trading signal. If you need it, please click Contact Me to get it.Disclaimer
The information and publications are not meant to be, and do not constitute, financial, investment, trading, or other types of advice or recommendations supplied or endorsed by TradingView. Read more in the Terms of Use.
Disclaimer
The information and publications are not meant to be, and do not constitute, financial, investment, trading, or other types of advice or recommendations supplied or endorsed by TradingView. Read more in the Terms of Use.