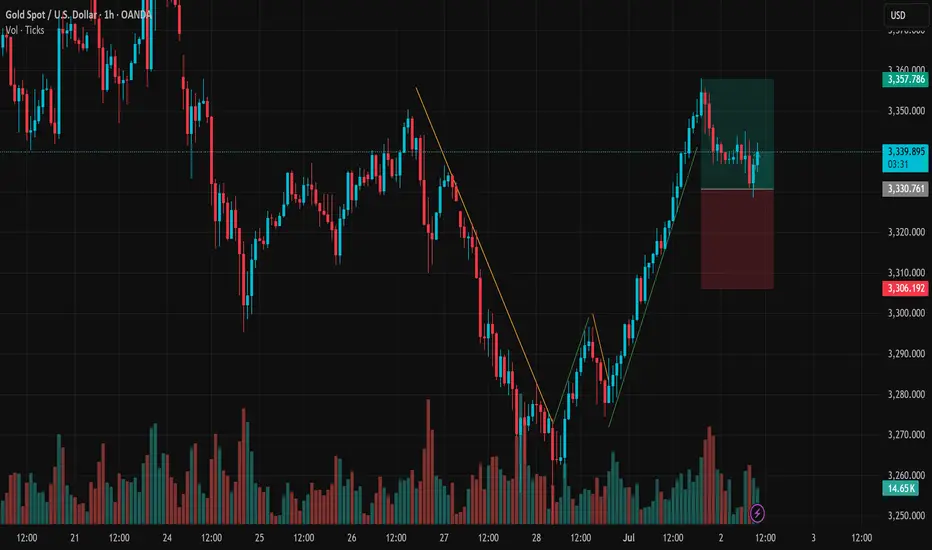
Gold (XAUUSD) on the 1H timeframe has staged a solid bullish reversal from the 3,263 USD support zone, reaching a recent high of 3,357 USD. Now, the market is entering a consolidation phase just below this resistance. This price action may be setting the stage for the next directional move.

After breaking a clear descending trendline, XAUUSD formed a two-leg bullish structure with higher highs and higher lows – a classic signal of trend reversal. The rally paused around 3,357 USD, a previous swing high acting as short-term resistance. The price is currently ranging between 3,330–3,340 USD with decreasing volume, indicating a potential accumulation zone rather than distribution.
Resistance: 3,357 USD – breakout target
Support zone: 3,330–3,335 USD – short-term demand zone
Invalidation level: 3,306 USD – below this, bullish structure breaks
As long as price holds above 3,330 USD, a bullish continuation remains the primary scenario. Traders can look for pullbacks or bullish patterns within this zone for potential long entries. A break and close above 3,357 USD would confirm strength, opening the path toward 3,370 or even 3,390 USD.
Stop-loss should be placed below 3,306 USD to manage risk if the breakout fails. If price loses the 3,306 support decisively, the setup turns neutral to bearish short-term.
The breakout leg was supported by rising volume, validating real demand. Current low-volume sideways movement suggests the market is “cooling off” after the rally, often a precursor to the next breakout move. Watching for bullish engulfing candles or volume spikes near support can offer trade confirmation.
Conclusion:
Gold remains in a bullish technical structure on the 1H chart. The current range between 3,330–3,357 USD is key. If price breaks above resistance, we could see strong continuation toward higher levels. Traders should stay patient, manage risk carefully, and let price action confirm the next move.
🪙 JOIN OUR FREE TELEGRAM GROUP 🪙
t.me/dnaprofits
Join the community group to get support and share knowledge!
️🥇 Exchange and learn market knowledge
️🥇 Support free trading signals
t.me/dnaprofits
Join the community group to get support and share knowledge!
️🥇 Exchange and learn market knowledge
️🥇 Support free trading signals
Related publications
Disclaimer
The information and publications are not meant to be, and do not constitute, financial, investment, trading, or other types of advice or recommendations supplied or endorsed by TradingView. Read more in the Terms of Use.