Gold’s candlestick chart has displayed multiple upper shadows above the 3025-3030 zone, widely regarded as a clear rejection signal. With repeated failures to break through this resistance, gold is showing signs of forming a potential short-term top. This not only caps the upside but could also act as a key indicator of a possible bearish reversal.
Following the Asian session's opening, gold experienced a slight gap up but failed to sustain its momentum, maintaining a range-bound movement instead. The lack of strong bullish follow-through reflects weak buying interest.
Additionally, recent statements from Trump suggest a softened stance on tariff policies, with his rhetoric appearing less aggressive. If the tariffs are implemented in a more moderate manner or market reactions are less severe than anticipated, risk-off sentiment could subside, leading to a significant pullback in gold prices.
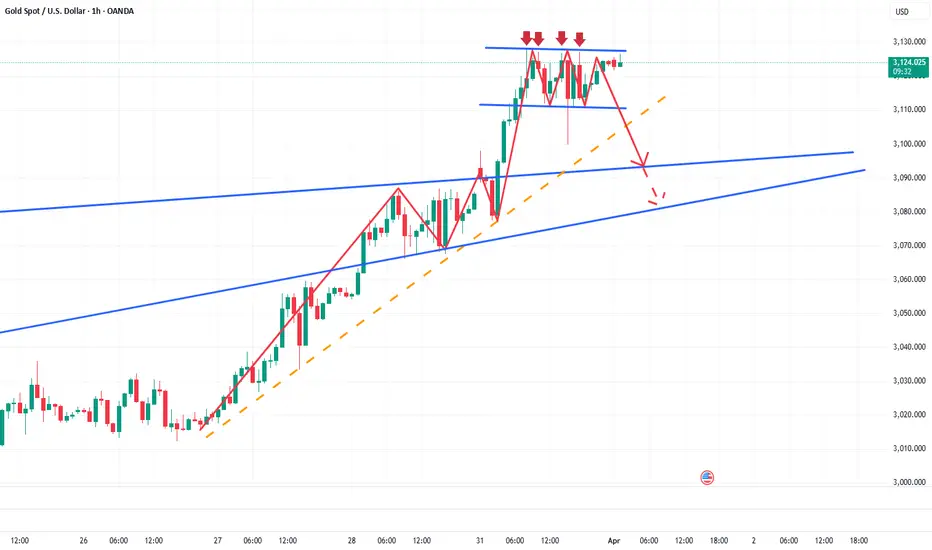
But given the presence of strong buying interest and bullish sentiment consolidation, expectations for an extensive decline remain limited. The primary support to monitor lies in the 3110-3100 range. If gold break below this zone, it may trigger an accelerated drop, with the next downside target at the 3095-3085 region.
The trading strategy verification accuracy rate is more than 90%; one step ahead, exclusive access to trading strategies and real-time trading settings
Following the Asian session's opening, gold experienced a slight gap up but failed to sustain its momentum, maintaining a range-bound movement instead. The lack of strong bullish follow-through reflects weak buying interest.
Additionally, recent statements from Trump suggest a softened stance on tariff policies, with his rhetoric appearing less aggressive. If the tariffs are implemented in a more moderate manner or market reactions are less severe than anticipated, risk-off sentiment could subside, leading to a significant pullback in gold prices.
But given the presence of strong buying interest and bullish sentiment consolidation, expectations for an extensive decline remain limited. The primary support to monitor lies in the 3110-3100 range. If gold break below this zone, it may trigger an accelerated drop, with the next downside target at the 3095-3085 region.
The trading strategy verification accuracy rate is more than 90%; one step ahead, exclusive access to trading strategies and real-time trading settings
Trade active
Bros, it is 8:26 AM, welcome to our wonderful day!We placed an order to short gold near 3023 overnight, and originally expected gold to fall back to around 3105, but gold has not fallen back effectively. Yesterday, it was also mentioned in the group that although there was a slight floating profit, we were not in a hurry to close the position after setting the SL to see if gold could fall back to the target area. But obviously, the effect was the opposite, and our short position hit the SL: 3132 in the early morning.
However, gold then continued to rebound to the area around 3146-3148, which is our ideal position for shorting gold, so I continue to short gold again in this area. Just now, gold fell back as expected, and I have closed short positions near 3128 to achieve the purpose of locking in profits in time!
Related publications
Disclaimer
The information and publications are not meant to be, and do not constitute, financial, investment, trading, or other types of advice or recommendations supplied or endorsed by TradingView. Read more in the Terms of Use.
Related publications
Disclaimer
The information and publications are not meant to be, and do not constitute, financial, investment, trading, or other types of advice or recommendations supplied or endorsed by TradingView. Read more in the Terms of Use.