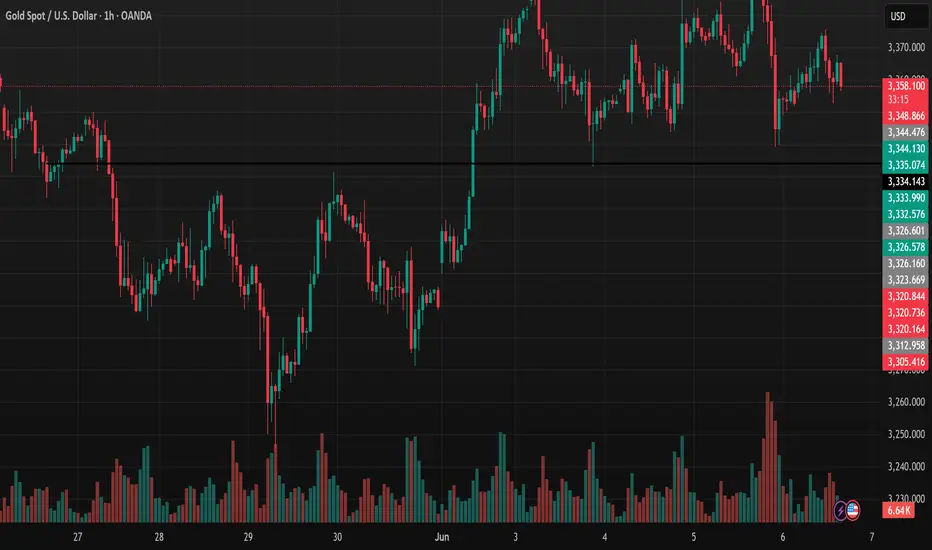
The Harmonic AB=CD pattern is a powerful technical analysis tool used to predict price reversals in financial markets. Based on Fibonacci ratios, it helps traders identify high-probability entry and exit points. This concise guide is designed for TradingView users to apply the pattern effectively.
Pattern Overview
- Structure: Four points (A, B, C, D). AB and CD legs are equal in length or follow Fibonacci ratios.
- Fibonacci Ratios:
- BC retraces 61.8%-78.6% of AB.
- CD equals AB (1:1) or extends 1.272/1.618 of BC.
- Types:
- Bullish: Signals a buy at point D (price rises).
- Bearish: Signals a sell at point D (price falls).
How to Identify and Trade
1. Spot AB: Find a clear price swing from A to B.
2. Measure BC: Use TradingView’s Fibonacci Retracement tool to confirm BC retraces 61.8%-78.6% of AB.
3. Project CD: Use Fibonacci Extension to project CD, matching AB’s length or extending 1.272/1.618 of BC.
4. Confirm D: Check for confluence with support/resistance, candlestick patterns (e.g., doji), or indicators (e.g., RSI divergence).
5. Trade Execution:
- Bullish: Buy at D, set stop-loss below D, target point C or A.
- Bearish: Sell at D, set stop-loss above D, target point C or A.
Tips for TradingView
- Use TradingView’s Fib tools for precision.
- Confirm signals with additional indicators (e.g., MACD, volume).
- Avoid choppy markets; focus on trending or range-bound charts.
The AB=CD pattern is a reliable method for spotting reversals when used with proper confirmation. By mastering Fibonacci tools on TradingView and combining the pattern with other signals, traders can enhance their decision-making and improve trade outcomes. Practice on historical charts to build confidence.
🪙 JOIN OUR FREE TELEGRAM GROUP 🪙
t.me/dnaprofits
Join the community group to get support and share knowledge!
️🥇 Exchange and learn market knowledge
️🥇 Support free trading signals
t.me/dnaprofits
Join the community group to get support and share knowledge!
️🥇 Exchange and learn market knowledge
️🥇 Support free trading signals
Disclaimer
The information and publications are not meant to be, and do not constitute, financial, investment, trading, or other types of advice or recommendations supplied or endorsed by TradingView. Read more in the Terms of Use.
