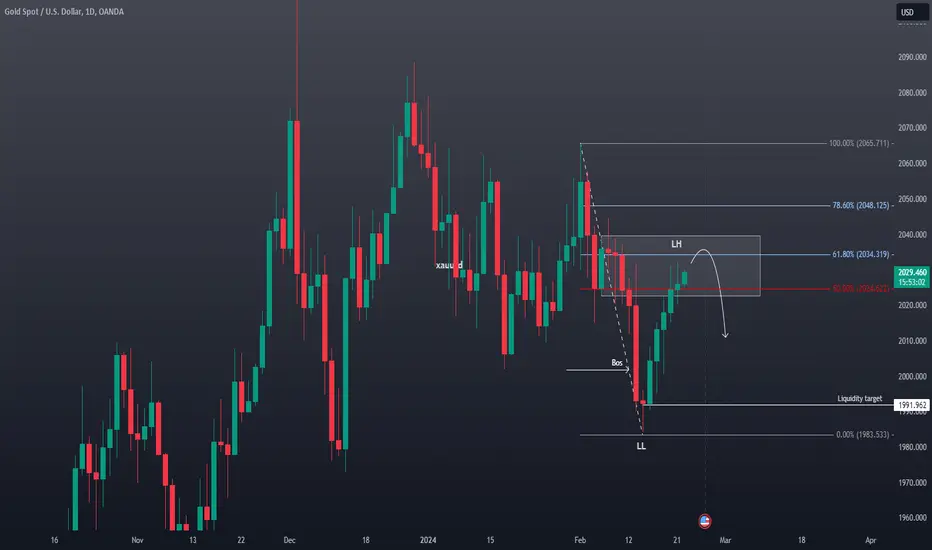
#XAUUSD currently exhibits a bearish bias on the daily timeframe.
Market Overview:
The daily chart reveals a significant break of market structure to the downside. This breach is characterized by lower highs and lower lows, signaling a shift in sentiment and potential weakness in gold prices.
Intraday Opportunity:
Traders should closely monitor the 61.8% Fibonacci retracement level. This area presents a potential sell opportunity. Short Entry: Consider initiating a short position if price approaches the 61.8% retracement level. Stop-Loss (SL): Place the stop-loss order above the previous highs to manage risk.Target: Aim for previous lows as potential profit-taking levels.
Risk Management:
As with any trading decision, conduct thorough research and analysis. Understand broader market dynamics, monitor relevant economic events, and assess risk factors. Implement sound risk management practices to safeguard your capital.
Important Disclaimer: This analysis provides a technical viewpoint based on price action and historical patterns. It does not constitute direct financial advice. Before executing any trades, perform your own due diligence, consider risk factors, and make informed decisions. Remember that trading involves inherent risks, and past performance is not indicative of future results.
👀 🚀 BUY/SELL SIGNALS INDICATORS THAT CUT THROUGH VOLATILITY WITH PRECISION 🔥💰
🔗 youtu.be/N1ZBqc4VA3U
👀 👉Join Our DISCORD For MORE Trade Ideas & Info:
🔗 discord.com/invite/PcBeCdwVQq
🔗 youtu.be/N1ZBqc4VA3U
👀 👉Join Our DISCORD For MORE Trade Ideas & Info:
🔗 discord.com/invite/PcBeCdwVQq
Disclaimer
The information and publications are not meant to be, and do not constitute, financial, investment, trading, or other types of advice or recommendations supplied or endorsed by TradingView. Read more in the Terms of Use.