📊 XAU/USD (Gold vs. USD) - 1H Chart Analysis
🔹 Entry & Risk-Reward Setup
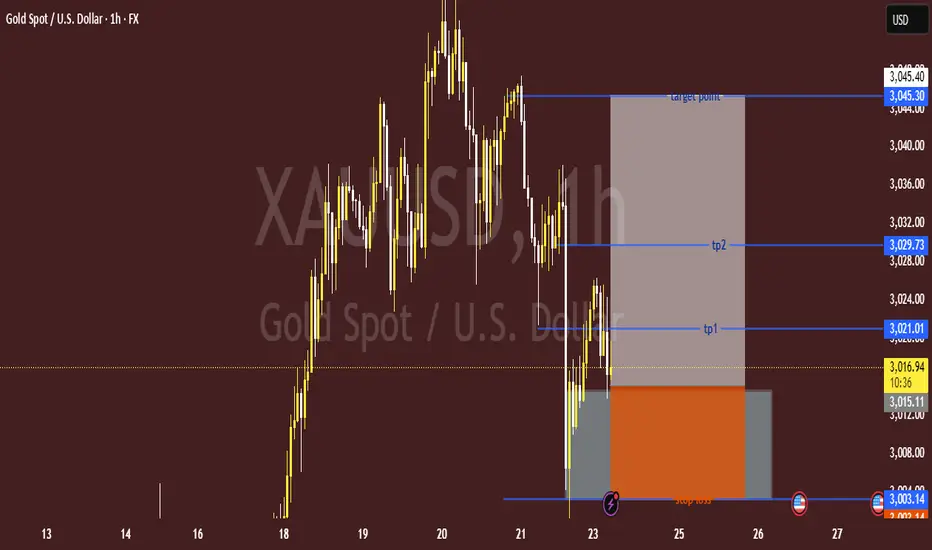
🟢 Buy Zone: $3,015 - $3,017 ✅
🛑 Stop Loss: $3,003.14 ❌ (Protects against downside risk)
🎯 Target Point: $3,045.40 🚀
🔹 Take Profit Levels (TP)
🟡 TP1: $3,021.01 🥇 (First checkpoint)
🟡 TP2: $3,029.73 🥈 (Second target, stronger resistance)
🔵 Final Target: $3,045.40 🏆 (Major resistance level)
🔹 Market Structure & Price Action
📉 Recent Drop: Found support near $3,003 📌
📈 Potential Upside: Price attempting a bullish reversal 📊
⚠️ Watch for breakout at $3,021+ for confirmation! 🚀📊
🔹 Entry & Risk-Reward Setup
🟢 Buy Zone: $3,015 - $3,017 ✅
🛑 Stop Loss: $3,003.14 ❌ (Protects against downside risk)
🎯 Target Point: $3,045.40 🚀
🔹 Take Profit Levels (TP)
🟡 TP1: $3,021.01 🥇 (First checkpoint)
🟡 TP2: $3,029.73 🥈 (Second target, stronger resistance)
🔵 Final Target: $3,045.40 🏆 (Major resistance level)
🔹 Market Structure & Price Action
📉 Recent Drop: Found support near $3,003 📌
📈 Potential Upside: Price attempting a bullish reversal 📊
⚠️ Watch for breakout at $3,021+ for confirmation! 🚀📊
Trade closed manually
Note
Looks like price action hit TP2! 🎯 From the chart, it seems like a classic breakout and retest setup. The price pushed up, hit the target point (TP2), and respected the stop-loss zone.Here’s a quick breakdown:
TP1 Hit: Price broke the initial resistance and reached TP1 smoothly.
TP2 Hit: The strong bullish momentum pushed the price to TP2. If someone held their position, they would have caught that move nicely!
Target Point: If the price maintains momentum, it could test the final target at 3,045.30. However, a pullback or consolidation near TP2 is possible.
Stop Loss Zone: The stop-loss placement below the support at 3,003.14 seems logical for risk management.
Do you have a position on this, or just analyzing for learning? 🤔📊
join my tellegram channel
t.me/JaMesGoldFiGhteR786
join my refferal broker
xmglobal.com/referral?token=S4yGyqPUmU9uAANtb_YUoA
t.me/JaMesGoldFiGhteR786
join my refferal broker
xmglobal.com/referral?token=S4yGyqPUmU9uAANtb_YUoA
Disclaimer
The information and publications are not meant to be, and do not constitute, financial, investment, trading, or other types of advice or recommendations supplied or endorsed by TradingView. Read more in the Terms of Use.