📌 Overview:
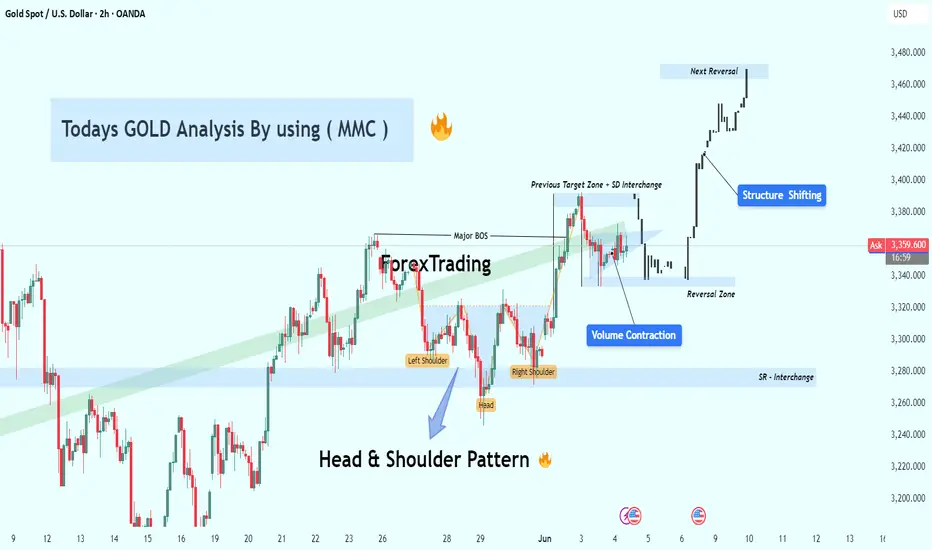
Today’s GOLD market presented an excellent educational setup using the MMC (Market Maker Cycle) methodology. We identified a Head & Shoulder reversal pattern, volume contraction at a key zone, a Major Break of Structure (BOS), and finally, a clear shift in market structure leading to a strong bullish move.
Let’s break it down step-by-step:
🧠 1. Head & Shoulders Pattern – The Early Reversal Signal
The pattern started forming around May 26–28, a classic Head & Shoulders that signaled potential exhaustion of the downtrend:
Left Shoulder: Price attempted to rise but failed to break previous highs.
Head: Sellers pushed to form a deeper low, forming the head.
Right Shoulder: Buyers entered again at the previous demand, creating a higher low than the head—indicating weakening bearish momentum.
🟦 The neckline was drawn across the swing highs. Once broken, it confirmed the reversal.
📍Significance: This pattern formed inside a strong SR Interchange Zone, where support turned resistance and vice versa—adding confluence.
🛠 2. Major Break of Structure (BOS) – Confirmation of Trend Shift
After forming the right shoulder, price decisively broke above the neckline and previous highs—this was the Major Break of Structure (BOS).
This is critical in MMC because:
It signals the end of the accumulation or manipulation phase.
It confirms that smart money has taken control and is pushing price in the new direction.
BOS acts as an entry trigger for traders using structure-based strategies.
💥 A strong bullish candle closed above the BOS level, showing aggressive buying.
📉 3. Volume Contraction – Smart Money Behavior
Between May 31 and June 2, we observed a tight consolidation at the previous resistance zone (now support).
Volume was contracting, forming a compression zone—a common sign of liquidity buildup by institutional players.
🧠 Why is this important?
Low volume ranges typically lead to high-volume breakouts.
This is the “accumulation before expansion” phase.
Smart money often accumulates orders here before a major move.
When price broke out of this compression, it did so with high momentum—validating this theory.
🔄 4. Structure Shifting – New Bullish Market Cycle
Following the BOS and breakout from volume contraction, price aggressively shifted its structure:
Higher highs and higher lows started forming.
Price invalidated bearish order blocks and respected bullish zones.
A new bullish market cycle under MMC began unfolding.
🚀 Price is now headed toward the Next Reversal Zone (around $3,460–$3,470), where we expect significant reaction.
🔍 5. Key Levels Explained
🔵 SR Interchange (~$3,280): This acted as a strong base for the Head & Shoulder formation. A key demand zone if price retraces.
🟦 Volume Contraction Zone (~$3,330–$3,350): Launchpad for the bullish impulse.
🟥 Next Reversal Zone (~$3,460–$3,470): A likely profit-taking or short-term reversal zone. Watch for bearish setups or consolidation here.
🎯 Strategy Insights (Based on MMC)
Entry Opportunity: After BOS + Retest of neckline or volume contraction zone.
Risk Management: Stop loss just below the previous low or reversal zone.
Target Zones: Next Reversal Zone or Fibonacci extensions depending on strategy.
📈 Conclusion
This GOLD chart is a textbook example of how technical confluences create high-probability setups:
✅ Head & Shoulder at demand
✅ Break of structure confirms reversal
✅ Volume contraction signals smart money entry
✅ Bullish expansion shows structure shift
🔔 Final Thought:
Watch closely how price reacts around the Next Reversal Zone. If bearish price action appears, it may provide a short-term reversal or retracement trade. Otherwise, a clean break above could signal the continuation of the bullish leg.
For Daily Trade Setups and Forecast: 📈 t.me/xauusdoptimizer
Premium Signals Fr33: 💯 t.me/xauusdoptimizer
🥰🥳🤩
Premium Signals Fr33: 💯 t.me/xauusdoptimizer
🥰🥳🤩
Related publications
Disclaimer
The information and publications are not meant to be, and do not constitute, financial, investment, trading, or other types of advice or recommendations supplied or endorsed by TradingView. Read more in the Terms of Use.