Core influencing factors
Dollar trend: The rebound of the US dollar index suppresses gold prices, but if the PCE data is lower than expected, the US dollar may fall back and provide support for gold.
Fed policy expectations: The market's expectations of interest rate cuts this year (currently priced at about 2 times) may limit the downward space of gold prices, but we need to be wary of hawkish rhetoric disturbances.
Risk aversion: Trade situation and geopolitical uncertainty may intermittently boost gold demand.
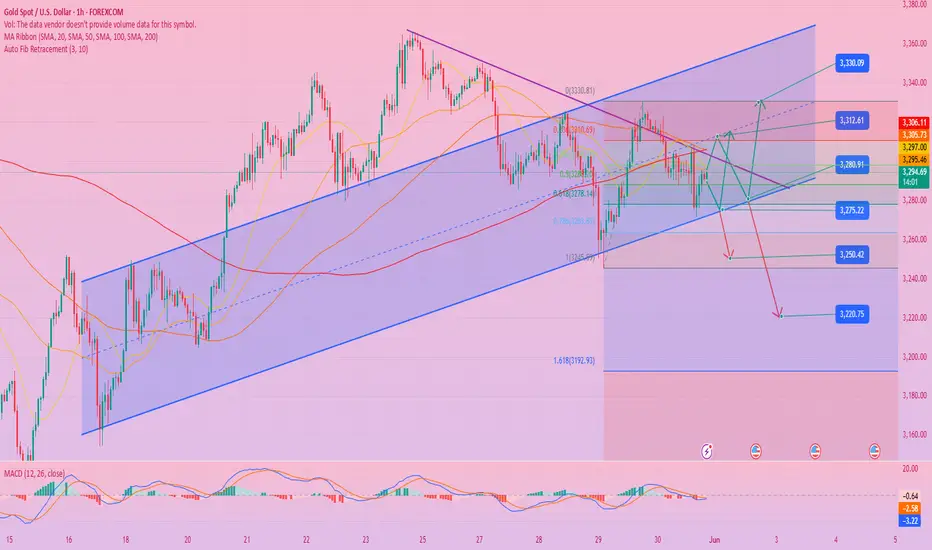
Technical key positions: $3300-3310 is a strong resistance zone, and $3260-3250 is short-term support.
Market outlook
Bearish signal:
The daily level failed to stand firm at the 3300 mark, and the 1-hour moving average turned downward, with short-term momentum biased to the bearish side.
If the US dollar continues to rebound or the PCE data is stronger than expected, the gold price may fall to the 3260-3250 support range.
Bullish signal:
If PCE data is weak or risk aversion heats up, gold prices may test the 3300-3315 resistance zone again.
Under the wide range of fluctuations at the monthly level, the buying support below 3260 may be strong.
Operation strategy
Short-term trading:
Short-term opportunity: When the rebound to the 3305-3315 range is under pressure, short with a light position, stop loss above 3320, target 3280-3265.
Long order opportunities: If it pulls back to the 3260-3250 area and stabilizes (such as the K-line shrinks or a hammer line appears), you can try long orders with a stop loss of 3240 and a target of 3280-3300.
Mid-term layout:
If it effectively falls below 3250 at the beginning of next week, it may open up the downward space to 3220-3200; on the contrary, if it stands firm at 3315, it will look up to 3340-3360.
Risk warning:
Market volatility may increase after Friday's PCE data, so be alert to rapid reversals.
Avoid chasing ups and downs, and pay attention to changes in volume near key positions.
Key points
Resistance: 3305-3315 (strong if broken), 3340 (previous high)
Support: 3280 (intraday), 3260-3250 (strong and weak boundary), 3220 (medium term)
Summary: Gold is short-term technically bearish, but fundamental support is still there. It is recommended to treat it with a volatile mindset, focus on the breakthrough direction of the 3300-3260 range, and be cautious in holding positions before and after the data.
Trade active
Gold prices closed lower on Friday (May 30) and the dollar strengthened as the market was assessing the impact of the latest tariff policy developments, while weak inflation data maintained market expectations for the Federal Reserve to cut interest rates. Spot gold closed at around $3,289 per ounce, down 0.83% on the day and more than 2.1% for the week. Tariff issues may continue to affect market trends next week after a federal appeals court ruled on Thursday to temporarily restore Trump-era tariff policies. In addition, Federal Reserve Chairman Powell will deliver an opening speech at an important event next Tuesday, which will be his first public statement since meeting with Trump this week. Several Federal Reserve officials will also speak during the same period. From a technical perspective, our team of professional investment analysts believes that gold prices may continue to test the support strength of the Bollinger Band middle track near $3,300 next week. If the geopolitical situation eases, prices may further drop to around $3,250.Trade closed: target reached
Analysis of the latest gold trend on June 3:
1. Analysis of the core drivers of the current market
Geopolitical risks escalate
The worsening of the conflict between Russia and Ukraine has boosted risk aversion demand. Gold, the US dollar and US bonds have strengthened simultaneously, indicating that the market has a strong risk aversion sentiment.
If the situation escalates further (such as NATO's direct intervention), the price of gold may accelerate to 3400+.
Trade friction risk
The United States intends to expand steel and aluminum tariffs. The market is worried that the global supply chain will be hit again. The rebound in inflation expectations is good for gold.
Key risk events this week
Non-agricultural data (if the job market cools down → the Fed's interest rate cut expectations heat up → bullish for gold)
Central bank policy (ECB/Fed officials' speeches, if dovish, support gold prices)
2. Key technical signals (1-hour chart)
✅ Trend structure
The moving average is arranged in a bullish pattern (5EMA > 10EMA > 20EMA), and the price runs along the upper track of the Bollinger band, which is strong in the short term.
Key support/resistance:
Support area: 3340-3350 (previous high support + Fibonacci 38.2% retracement)
Resistance area: 3380 (psychological barrier) → 3400 (previous high + integer barrier)
✅ Momentum indicator
MACD: Double-line golden cross, the bar is enlarged, but close to the overbought area, be wary of short-term corrections.
RSI(14): 62 (not overbought, still has room to rise).
III. Refined Trading Strategy
1. Long Entry Plan
(1) Pullback and Go Long (Main Strategy)
Ideal Entry Range: 3340-3350 (Combined with K-line reversal signals, such as hammer line/bullish engulfing)
Stop loss: 3328 (break through previous low + channel lower track, confirm trend destruction)
Target 1: 3375-3380 (previous high pressure, partial profit stop)
Target 2: 3400 (look to 3420 after breakthrough)
(2) Breakout and Go Long (Secondary Strategy)
If the price breaks through 3380 strongly and stabilizes, you can go long with a light position, stop loss 3365, and target 3400-3420.
2. Short Hedging Strategy (Caution!)
If the price falls below 3328, it may turn short, and you can look to 3310-3300 in the short term (but it depends on whether the fundamentals have turned).
IV. Risk management and position control
Position ratio: a single transaction should not exceed 3%-5% of the total funds.
Stop loss discipline: strictly stop loss at 3328 and avoid emotional holding of orders.
Dynamic stop profit:
If the price reaches 3375-3380, you can reduce your position by 50%, and the remaining position will be protected by stop loss to 3350.
If it reaches 3400, exit all or keep a very small position to fight for higher prices.
Related publications
Disclaimer
The information and publications are not meant to be, and do not constitute, financial, investment, trading, or other types of advice or recommendations supplied or endorsed by TradingView. Read more in the Terms of Use.
Related publications
Disclaimer
The information and publications are not meant to be, and do not constitute, financial, investment, trading, or other types of advice or recommendations supplied or endorsed by TradingView. Read more in the Terms of Use.