Hey Everyone,
This is the daily chart idea that we have been tracking for a while. This has been playing out to perfection level to level.
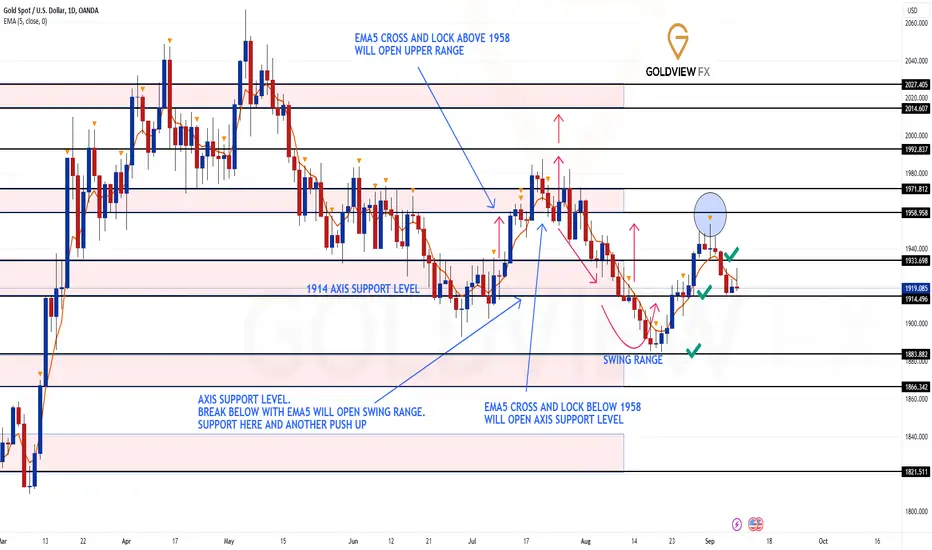
As stated last week the weighted levels and AXIS breaks allowed us to track the movement down and then all the way up over the last few months. The swing range played out perfectly providing the support and the bounce, which we were able to catch using our smaller timeframes.
We tracked the movement from the swing rang, all the way into the identified resistance structure highlighted on the chart and just fell short by a few pips to complete the 1958 TARGET.
We will keep the above in mind, while buying dips on our smaller timeframe setups.
Please don't forget to like, comment and follow to support us, we really appreciate it!
MR GOLD
This is the daily chart idea that we have been tracking for a while. This has been playing out to perfection level to level.
As stated last week the weighted levels and AXIS breaks allowed us to track the movement down and then all the way up over the last few months. The swing range played out perfectly providing the support and the bounce, which we were able to catch using our smaller timeframes.
We tracked the movement from the swing rang, all the way into the identified resistance structure highlighted on the chart and just fell short by a few pips to complete the 1958 TARGET.
We will keep the above in mind, while buying dips on our smaller timeframe setups.
Please don't forget to like, comment and follow to support us, we really appreciate it!
MR GOLD
🪙 JOIN OUR FREE TELEGRAM GROUP 🪙 t.me/GoldView_FX
🪙 JOIN OUR DISCORD FOR BACKUP 🪙
discord.com/invite/9ZrEHGuaE2
🏆MESSAGE US FOR VIP SIGNALS🏆
t.me/GoldviewFX
or
email goldviewfx@gmail com
🪙 JOIN OUR DISCORD FOR BACKUP 🪙
discord.com/invite/9ZrEHGuaE2
🏆MESSAGE US FOR VIP SIGNALS🏆
t.me/GoldviewFX
or
email goldviewfx@gmail com
Related publications
Disclaimer
The information and publications are not meant to be, and do not constitute, financial, investment, trading, or other types of advice or recommendations supplied or endorsed by TradingView. Read more in the Terms of Use.