🔥 Key Levels & Zones
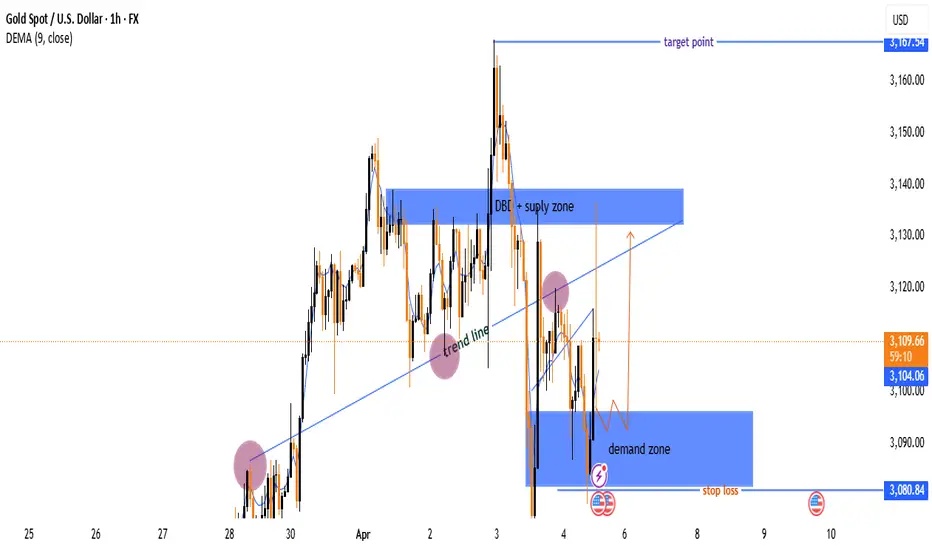
🔵 Supply Zone (3,135-3,140 USD) 📉
Acts as resistance where selling pressure increases.
If price reaches here, expect a potential pullback.
🟢 Demand Zone (3,085-3,095 USD) 📈
Strong support area with buying interest.
Price has tested this zone multiple times = accumulation.
🎯 Target Point (~3,167 USD) 🚀
If price breaks out, it may rally towards this level!
❌ Stop Loss (~3,080 USD) ⛔
Marked below demand zone to limit risk.
---
📊 Trend Analysis
🔹 Trend Line Break ⚡
The price broke the previous uptrend = potential reversal or deeper correction.
🔹 Market Structure 🏗️
Price consolidating inside the demand zone = possible bullish move ahead.
🔹 Double Bottom Formation (DBF) at Supply Zone 🔄
Shows failed breakout attempts = strong resistance.
---
🔍 Indicators & Insights
📌 DEMA (9 close) at 3,099 USD 📈
Price hovering around this moving average = market indecision.
---
🚦 Possible Scenarios
✅ Bullish Scenario:
If price holds the demand zone & breaks above 3,110 USD, it could rally to supply zone (~3,135 USD).
A breakout above 3,140 USD could lead to the target zone (~3,167 USD) 🚀.
❌ Bearish Scenario:
If price breaks below 3,085 USD, it may hit stop loss (3,080 USD) and continue lower.
---
🎯 Trading Plan
🟩 Long Entry ➡️ Around 3,090-3,100 USD 📊
🛑 Stop Loss ➡️ Below 3,080 USD 🚨
🎯 Target ➡️ 3,135-3,167 USD 🎉
join my tellegram channel
t.me/JaMesGoldFiGhteR786
join my refferal broker
xmglobal.com/referral?token=S4yGyqPUmU9uAANtb_YUoA
t.me/JaMesGoldFiGhteR786
join my refferal broker
xmglobal.com/referral?token=S4yGyqPUmU9uAANtb_YUoA
Disclaimer
The information and publications are not meant to be, and do not constitute, financial, investment, trading, or other types of advice or recommendations supplied or endorsed by TradingView. Read more in the Terms of Use.