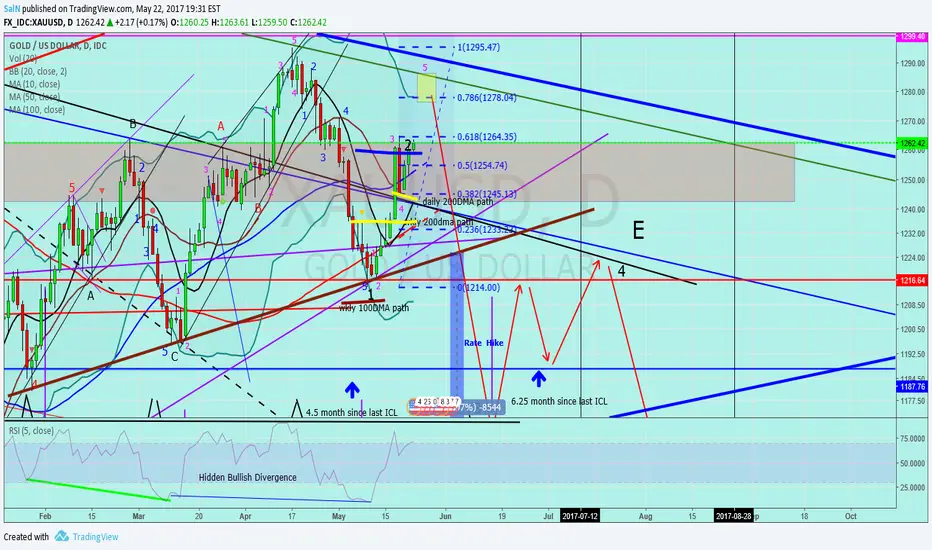
I decided to start with the gold chart today. We have once again closed above the 50 week MA, which is the thick blue line. I am looking for price to move above 1264.75 to confirm that we are in a wave 5. If that is confirmed, probably overnight, then I am targeting that yellow box area for a top for gold. Then we should turn down with a vengeance. I am not one that believes that we just completed a ICL a couple of weeks ago. Price is supposed to break the trend line not bounce off of it. Plus we have a rate hike coming up in June and as is typical gold behavior, gold drops until the day of the rate hike and then rallies pretty hard. So if I am correct, and gold pushes up to that yellow box, this should help Jnug finally rally past that red resistance area. It will have a hard time moving much higher than the gap fill due to the BBands being already compressed and the 50 DMA up there as well. Lets see how tomorrow goes.
Jnug chart will be posted next.
Jnug chart will be posted next.
Note
Note
SO I got a message today from someone pointing out the very nice abc pattern that appears to be nearly finished on the daily chart. I went ahead and measured the "a" drop and then applied that measurement to the "c" drop. As you can see form the light green measurement, we might drop a little bit more to the $16.53 range before finally starting the elusive 5th wave up. Fourth waves are typically annoying and difficult to read. Lets see how this plays out tomorrow.
Disclaimer
The information and publications are not meant to be, and do not constitute, financial, investment, trading, or other types of advice or recommendations supplied or endorsed by TradingView. Read more in the Terms of Use.
Disclaimer
The information and publications are not meant to be, and do not constitute, financial, investment, trading, or other types of advice or recommendations supplied or endorsed by TradingView. Read more in the Terms of Use.