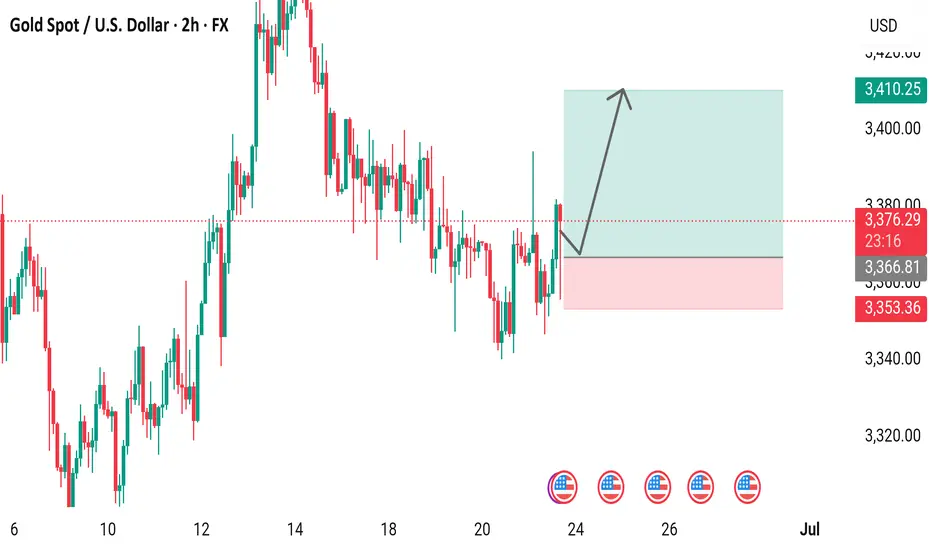
2-hour candlestick chart displays the price movement of Gold Spot (XAUUSD) against the U.S. Dollar, with the current price at 3,373.97, reflecting a +5.99 (+0.18%) change. The chart highlights recent price trends, including a notable upward movement, with key support and resistance levels marked around 3,366.81 and 3,410.25, respectively. The time frame spans from approximately 6:00 AM to 3:35 PM CEST on June 23, 2025.
Daily XAU/USD FREE setups | Let's grow together!
| XAU/USD Trader | Telegram: https://t.me/Aleegoldsignals
| XAU/USD Trader | Telegram: https://t.me/Aleegoldsignals
Disclaimer
The information and publications are not meant to be, and do not constitute, financial, investment, trading, or other types of advice or recommendations supplied or endorsed by TradingView. Read more in the Terms of Use.