Quantum EdgeX is a visual trading tool designed to help identify potential trend reversals to the downside based on RSI and price behavior. It works across different Instruments and timeframes
https://tradingview.sweetlogin.com/script/KzHz0hBR-Quantum-EdgeX/
What It Does:
1.Quantum EdgeX monitors overall price behavior in relation to RSI dynamics and marks potential moments where weakness may be forming.
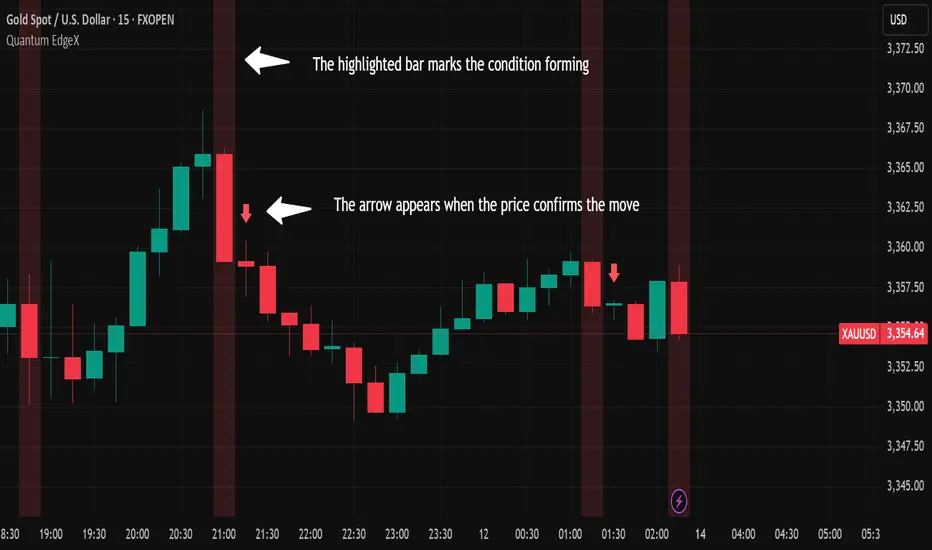
2.It plots a arrow above the bar when specific conditions are detected and highlights the relevant candle in the background to help you visually track the event.
3.The background highlight remains visible even after a arrow is shown, giving users a visual reference of the condition.
How to Use:
1.Apply Quantum EdgeX to any chart — works for all instruments.
2.Compatible with any timeframe.
3.Best used to support your existing trading analysis.
4. Use the indicator directly as all settings are locked and pre-configured, so there is no need to change anything.
Example Chart:

Access:
This is a Public Invite-Only indicator.
To request access, send a message through my Trading View profile.
⚠️ Disclaimer:
This script is for educational purposes only and is not financial advice. Always use your own analysis and risk management before entering any trade.
https://tradingview.sweetlogin.com/script/KzHz0hBR-Quantum-EdgeX/
What It Does:
1.Quantum EdgeX monitors overall price behavior in relation to RSI dynamics and marks potential moments where weakness may be forming.
2.It plots a arrow above the bar when specific conditions are detected and highlights the relevant candle in the background to help you visually track the event.
3.The background highlight remains visible even after a arrow is shown, giving users a visual reference of the condition.
How to Use:
1.Apply Quantum EdgeX to any chart — works for all instruments.
2.Compatible with any timeframe.
3.Best used to support your existing trading analysis.
4. Use the indicator directly as all settings are locked and pre-configured, so there is no need to change anything.
Example Chart:
Access:
This is a Public Invite-Only indicator.
To request access, send a message through my Trading View profile.
⚠️ Disclaimer:
This script is for educational purposes only and is not financial advice. Always use your own analysis and risk management before entering any trade.
Disclaimer
The information and publications are not meant to be, and do not constitute, financial, investment, trading, or other types of advice or recommendations supplied or endorsed by TradingView. Read more in the Terms of Use.
Disclaimer
The information and publications are not meant to be, and do not constitute, financial, investment, trading, or other types of advice or recommendations supplied or endorsed by TradingView. Read more in the Terms of Use.