On Friday, the gold bulls and bears were in a stalemate, and the overall market fluctuated around 2978-3005. As the weekly line closed higher, it means that the bulls have been released and will start to plummet next week.
From the time window, next Thursday is exactly the 89th trading day since gold rose from 2536 on November 14 last year. If it rises from 2832 on February 28, it is almost 13 trading days, which is in line with the law of market change time. In addition, the Federal Reserve will also announce the interest rate decision and press conference in the early hours of Thursday. Perhaps only under the promotion of the Federal Reserve's news can a new round of collapse be triggered! ! !
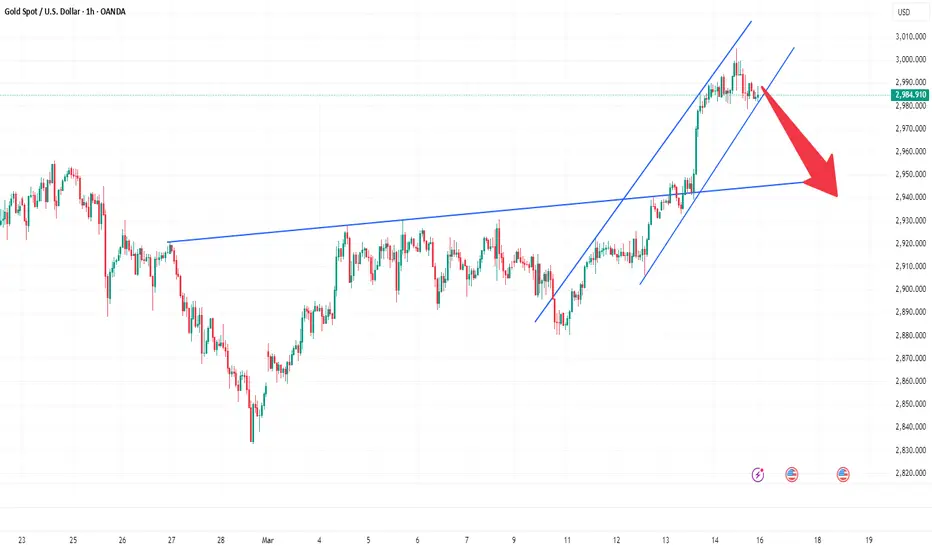
In the short term, gold rose and fell last Friday. The daily chart has a $15 upper shadow line, and the upper shadow line indicates that the upper pressure is strong and the market has a clear downward trend. Therefore, the overall market next Monday tends to fall first and then rise! ! !
Judging from the gold hourly chart, there are several positions to focus on next Monday. First, the hourly chart rising trend line support level is 2982. If it breaks below, it will fall further to around 2940. Second, the 61.8% position of the golden ratio of 3005-2978 is around 2995. Third, last Friday’s high is 3005, and a breakthrough is impossible.
You can read bottom signals, interpret daily market trends, share real-time strategies, and no longer blindly follow the trend.
From the time window, next Thursday is exactly the 89th trading day since gold rose from 2536 on November 14 last year. If it rises from 2832 on February 28, it is almost 13 trading days, which is in line with the law of market change time. In addition, the Federal Reserve will also announce the interest rate decision and press conference in the early hours of Thursday. Perhaps only under the promotion of the Federal Reserve's news can a new round of collapse be triggered! ! !
In the short term, gold rose and fell last Friday. The daily chart has a $15 upper shadow line, and the upper shadow line indicates that the upper pressure is strong and the market has a clear downward trend. Therefore, the overall market next Monday tends to fall first and then rise! ! !
Judging from the gold hourly chart, there are several positions to focus on next Monday. First, the hourly chart rising trend line support level is 2982. If it breaks below, it will fall further to around 2940. Second, the 61.8% position of the golden ratio of 3005-2978 is around 2995. Third, last Friday’s high is 3005, and a breakthrough is impossible.
You can read bottom signals, interpret daily market trends, share real-time strategies, and no longer blindly follow the trend.
Trade active
I have always been glad that I can stick to my original intention and do my best to serve every friend who proposes cooperation, and use my professional strength to help you make profits, recover your investment, and increase the value of funds. My reputation is entirely based on the publicity of my customers, and my strength is honed in actual combat. Even if the road ahead is bumpy, as long as you trust me, we will do our best to guide you, so that your funds can play the greatest role and let you experience the pleasant feeling of profit in the ups and downs of the market!Related publications
Disclaimer
The information and publications are not meant to be, and do not constitute, financial, investment, trading, or other types of advice or recommendations supplied or endorsed by TradingView. Read more in the Terms of Use.
Related publications
Disclaimer
The information and publications are not meant to be, and do not constitute, financial, investment, trading, or other types of advice or recommendations supplied or endorsed by TradingView. Read more in the Terms of Use.