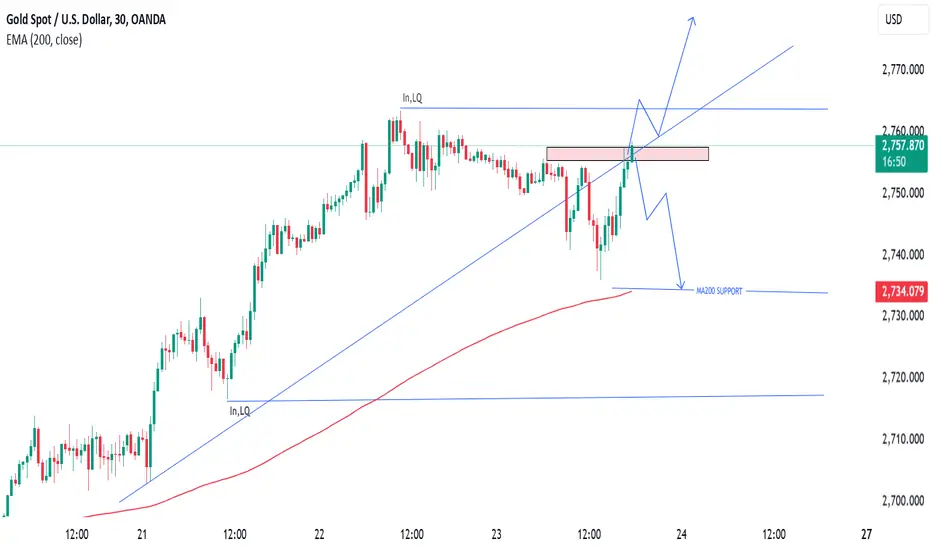
Gold Price Analysis: 🔑 Key Zones and 📉 Potential Reversal at MA200
1️⃣ Resistance Zone 🟥:
The red-highlighted area marks a strong resistance zone. A breakout 🚀 above this level could lead to bullish momentum.
2️⃣ Liquidity Zones 💧:
The "In LQ" region shows where liquidity may be resting, suggesting possible retracements or reversals near this point.
3️⃣ 200 EMA Support 📊:
The MA200 (2,734.059) is a critical support level. A breakdown 🔻 here could send prices lower, testing further support levels.
📈 Potential Scenarios:
🔼 Bullish: Break above resistance 🟥 with higher highs.
🔽 Bearish: Rejection from resistance 🟥 leading to a drop toward the MA200 support 📉.
Watch these levels closely! 🔎
Trade closed: target reached
Gold Update: Analysis Hit Successfully!🎯 Our predicted key zones and levels played out perfectly on Gold! Stay tuned for more updates and insights.
JOIN MY TELEGRAM CHANNEL
t.me/StellarMarketAnalysis
JOIN MY RECOMMENTED BROKER REFFREL LINK
⤵️one.exnesstrack.net/a/uvd1etcgg1
PARTNER CODE⤵️
uvd1etcgg1
t.me/StellarMarketAnalysis
JOIN MY RECOMMENTED BROKER REFFREL LINK
⤵️one.exnesstrack.net/a/uvd1etcgg1
PARTNER CODE⤵️
uvd1etcgg1
Related publications
Disclaimer
The information and publications are not meant to be, and do not constitute, financial, investment, trading, or other types of advice or recommendations supplied or endorsed by TradingView. Read more in the Terms of Use.