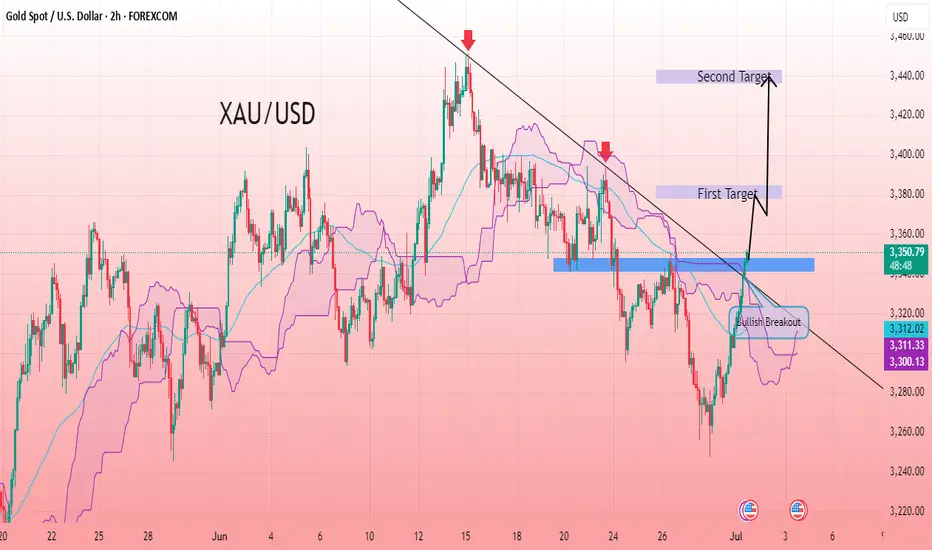
XAUUSD 2H chart shows a clear trendline breakout after a period of consolidation, indicating a potential bullish continuation. The breakout occurred with strong momentum, supported by clear higher lows before the break, signaling buyer interest. Price action has closed firmly above the trendline, confirming the breakout structure and suggesting the potential for further upward movement if momentum continues. The breakout zone can now act as a support if price retests before continuation. The structure aligns with a bullish scenario, and the breakout level will be monitored for validation. A clean follow-through move is anticipated as long as the breakout structure holds, providing an opportunity for a controlled and patient approach toward the targets.
Entry 3347
First Target 3381
Second Target 3440
Entry 3347
First Target 3381
Second Target 3440
Trade active
Hold in buyJoin telegram channel free ..
t.me/GoldMan0009
Forex, Gold & Crypto Signals with detailed analysis & get consistent results..
Gold Signal's with proper TP & SL for high profit opportunities..
t.me/GoldMan0009
t.me/GoldMan0009
Forex, Gold & Crypto Signals with detailed analysis & get consistent results..
Gold Signal's with proper TP & SL for high profit opportunities..
t.me/GoldMan0009
Disclaimer
The information and publications are not meant to be, and do not constitute, financial, investment, trading, or other types of advice or recommendations supplied or endorsed by TradingView. Read more in the Terms of Use.
Join telegram channel free ..
t.me/GoldMan0009
Forex, Gold & Crypto Signals with detailed analysis & get consistent results..
Gold Signal's with proper TP & SL for high profit opportunities..
t.me/GoldMan0009
t.me/GoldMan0009
Forex, Gold & Crypto Signals with detailed analysis & get consistent results..
Gold Signal's with proper TP & SL for high profit opportunities..
t.me/GoldMan0009
Disclaimer
The information and publications are not meant to be, and do not constitute, financial, investment, trading, or other types of advice or recommendations supplied or endorsed by TradingView. Read more in the Terms of Use.